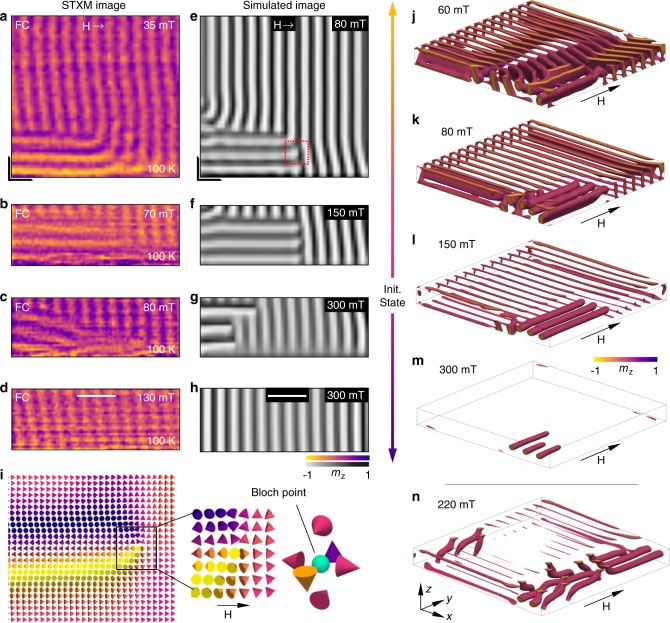
Fig. 4. Experimental observation and micromagnetic simulations of skyrmion tubes.
a–d Scanning transmission x-ray micrographs of the skyrmion tube spin texture embedded in the conical state observed as a function of applied in-plane magnetic field. The colourmap plots the normalised out-of-plane magnetisation averaged through the thickness of the sample, mz. The black L-shape in a indicates the location of the corner of the sample. e–h Simulated images of the skyrmion tube spin texture embedded in the conical state, as determined from micromagnetic simulations calculated as a function of applied in-plane magnetic field, where the colourmap plots the normalised out-of-plane magnetisation averaged through the thickness. i A cross section of spins from the simulation in e, location shown by the red box, highlighting the presence of a magnetic Bloch point at the end of each skyrmion tube. j–m Three dimensional visualisations of the micromagentic simulations for selected magnetic fields, obtained by plotting cells with normalised my between -1 and 0. n Three dimensional visualisation of the skyrmion tube state achieved after a field sweep from an initially randomised state. Scale bars, 200 nm.

