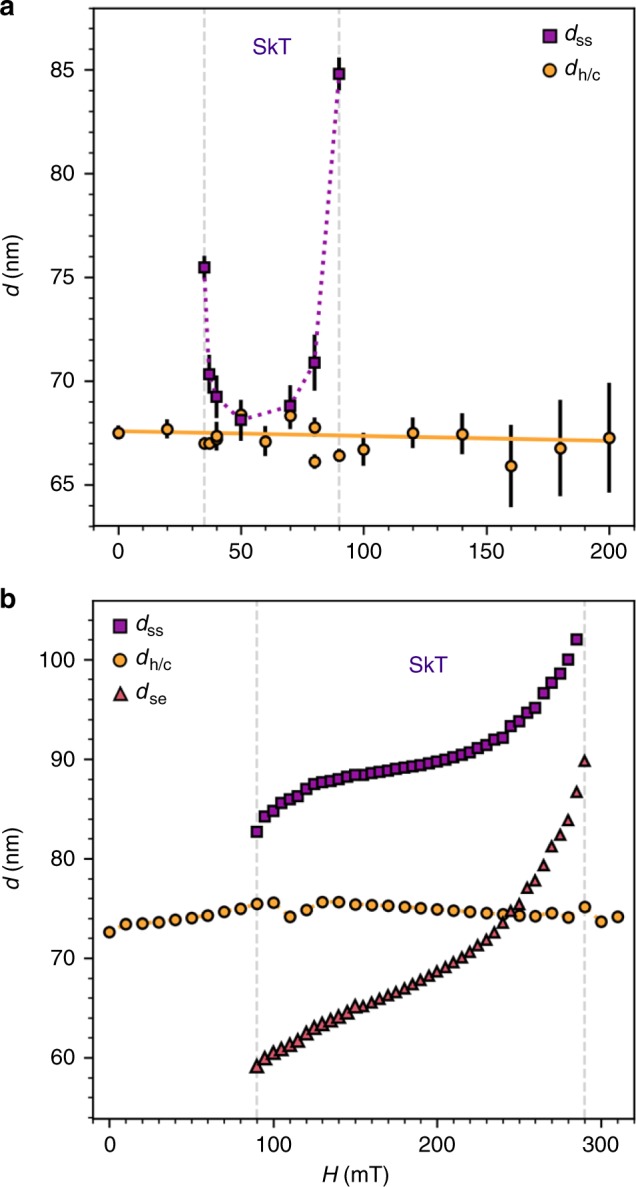
Fig. 5. Spacing of the skyrmion tube state.

a, b The skyrmion-skyrmion tube spacing, dss, the skyrmion-edge distance dse, and helical/conical state period, dh∕c, plotted as a function of applied magnetic field for the experimental and simulated images respectively. Error bars on the experimental data indicate the standard deviation obtained when fitting line profiles of the magnetic contrast from the STXM images with a sine function.
