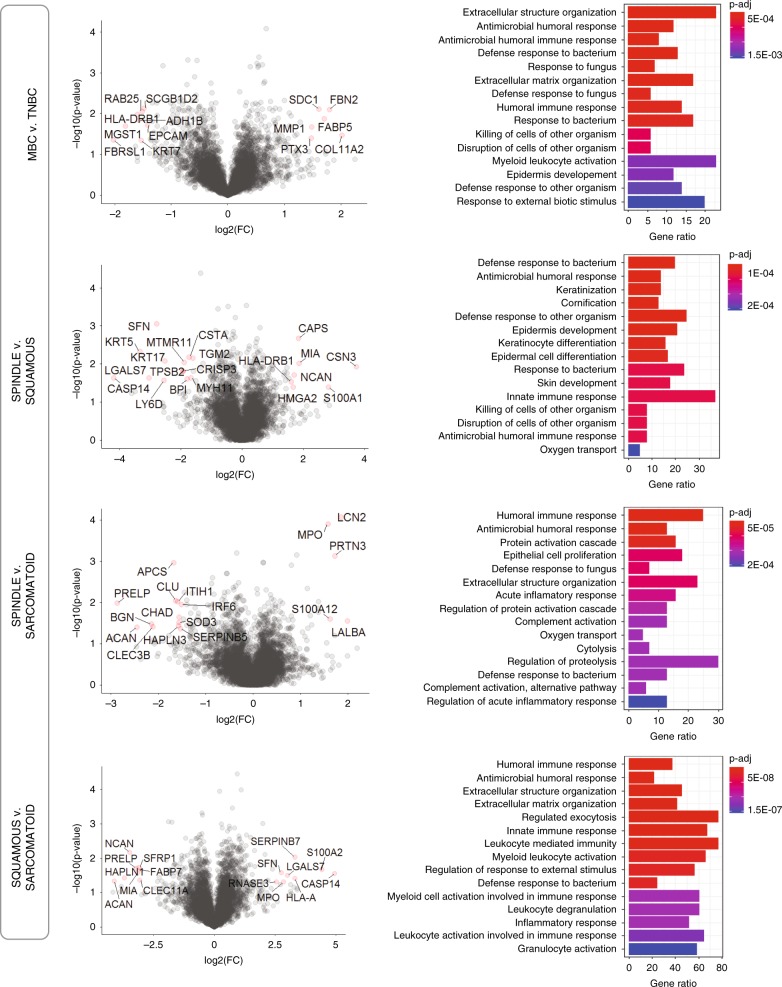
Fig. 3. Differential expression analysis of histological MBC subtypes.
Left: Volcano plots comparing MBC with TNBC and within MBC subtypes, as indicated. Significantly differentially expressed proteins are highlighted in red. log2-Fold change versus –log10(p-value), where cutoff values on plots show FC > 1 or FC < −1 (vertical lines) and p < 0.01 (horizontal line), n = 20 patients. Right: Enrichment analysis using gene ontology (GO) annotations showing the top GO terms based on biological process, molecular function, or cellular compartment. Significant proteins were considered using p-value < 0.05, q-value < 0.1, fold change (log2-FC) >1, Benjamini–Hochberg correction (BH), gene set size 5–500, and the total protein list (5670 proteins) as the background set. Barplot shows significant terms by the gradient legend as p-adjust < 0.001, the x-axis is gene ratio and the number of proteins belonging to given enriched terms.

