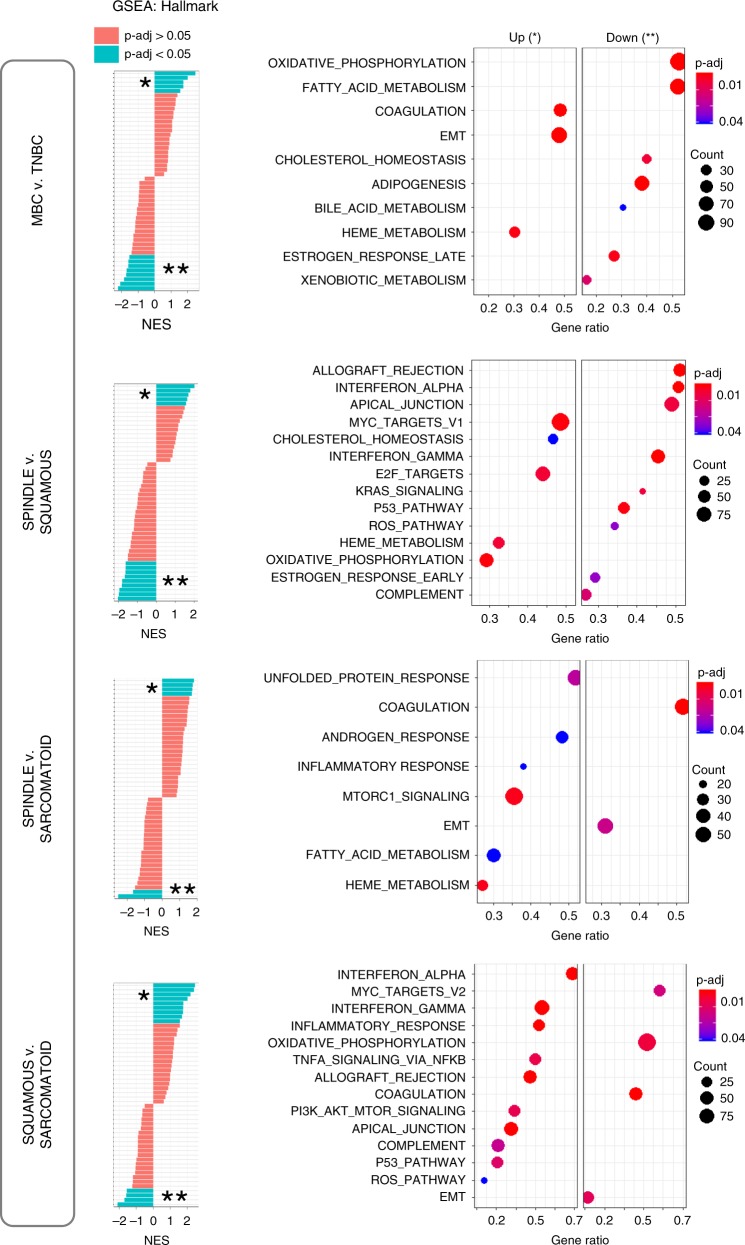
Fig. 4. GSEA reveals hallmark pathways within MBC and relative to TNBC.
GSEA analyses show differentially expressed protein pathways in MBC compared with TNBC, and within MBC subtypes. Left: normalized enrichment scores (NES) versus the total list of GSEA hallmark upregulated (*) and downregulated (**) categories, with significantly enriched terms (p-adjust < 0.05) among non-enriched (p-adjust > 0.05). Right: only the top hallmark up- and downregulated pathways labeled as UP (*) and DOWN (**), highlighting unique significantly expressed categories, where the x-axis is gene ratio. The GSEA analysis was performed using the clusterProfiler and fgsea package in R for the hallmark collection (H) (Broad Institute), with n = 1000 permutations, where p-adjust < 0.05 and FDR < 0.05 were considered significant.

