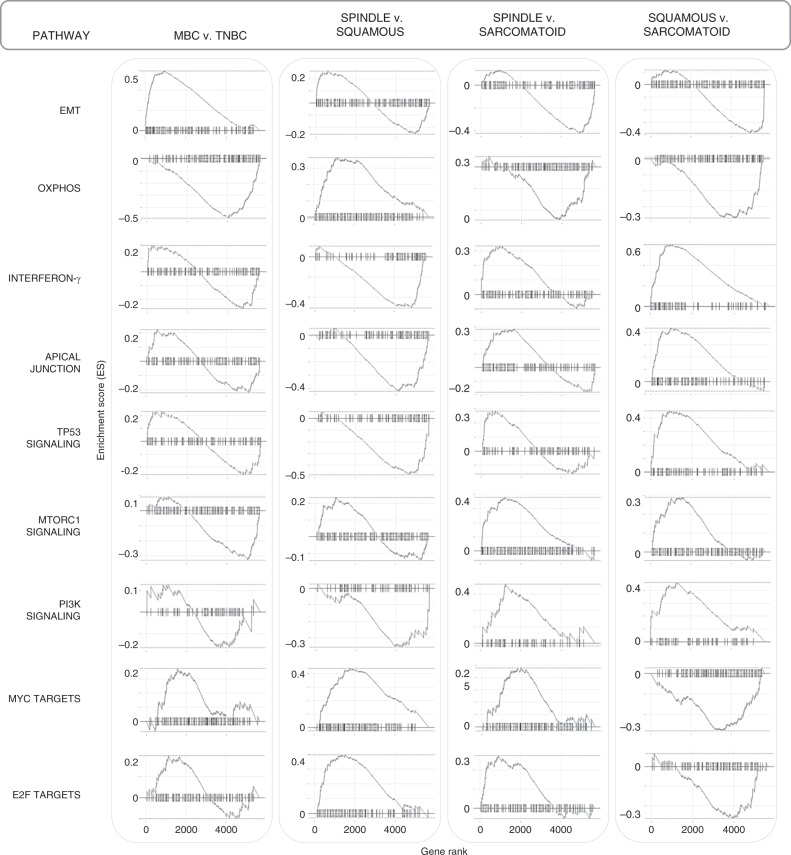
Fig. 5. Top enriched pathway profiles distinguish MBC subtypes and TNBC.
GSEA enrichment plots of the highest up- or downregulated pathways by carcinoma type, including epithelial-mesenchymal transition (EMT), oxidative phosphorylation, interferon-γ, apical junction, TP53, MTORC1, and PI3K signaling, and MYC and E2F target pathways. The GSEA analysis was performed using the fgsea package in R for the hallmark collection (H) (Broad Institute), with n = 1000 permutations, where p-adjust < 0.05 and FDR < 0.05 were considered significant.

