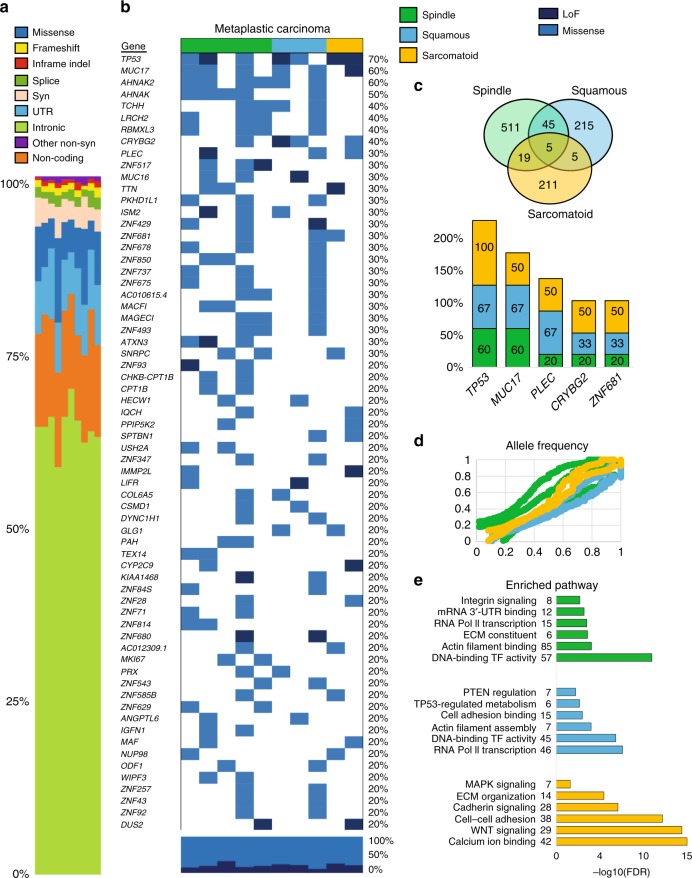
Fig. 6. WES analysis shows repertoire of somatic mutations within MBC.
a The landscape of somatic mutations common to MBC and within subtype-specific histopathologies of 10 patients with MBC including spindle (N = 5), squamous (N = 3) and sarcomatoid (N = 2) and matching normal breast tissues. The type of mutation is color-coded as indicated in the legend. Pathogenic mutational variants in MBC were defined as those of high complexity (980 of 11,652 total) were filtered in this analysis. Syn: synonymous, INDEL: inframe insertions and deletions. b Heat map shows the top mutated genes with 20% of greater frequency of missense (blue) or loss-of-function mutations, LoF (dark blue). c Venn diagram highlights the number common and distinct mutated genes in MBC subtypes. Bars show the frequency of the five commonly mutated genes (TP53, MUC17, PLEC, CRYBG2, ZNF681) in each subtype. d Scatterplot is average allele frequency (AF) for each tumor sample, and colors represent metaplastic subtype. We excluded the variants with population allele frequency >5% based on 1000 Genome Project data. e Top enriched GO and pathways (KEGG, Panther, or Reactome) of mutated genes in MBC subtypes. Enrichment analysis was performed using gene lists extracted for each MBC according to the gene-level variant and effect summary analysis using GeneRollupv0.3.2. Variants that fell in low complexity genomic regions, genomic super DUPS, and repeat masker regions were excluded.

