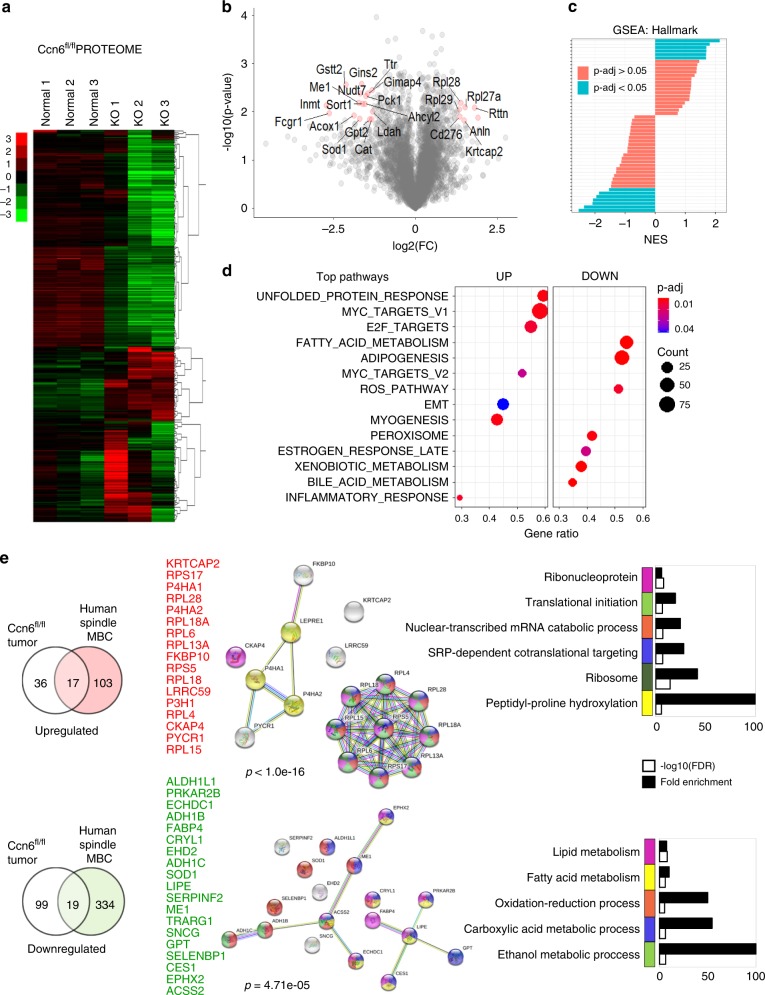
Fig. 7. Quantitative proteomics analysis of mouse MBC (MMTV-cre;Ccn6fl/fl).
a Heat map of the 4609 proteins that passed through quality filters in TMT-Integrator for all samples (3 MMTV-cre;Ccn6fl/fl mouse tumors (KO) and 3 normal mouse mammary glands). Scale bar shows expression level (red is upregulated and green is downregulated). b Volcano plot comparing Ccn6fl/fl tumors with normal mammary gland. Significantly differentially expressed proteins are highlighted in red. p < 0.05 and absolute value FC > 1 were considered significant. c Gene set enrichment analysis (GSEA) showing significant differentially expressed protein pathways in Ccn6fl/fl spindle MBCs compared with normal mammary glands. Normalized enrichment scores (NES) versus the total list of GSEA hallmark categories of up and downregulated hallmark pathways. d Top hallmark pathways highlighting significantly expressed up- and downregulated protein pathways (marked UP and DOWN, respectively). We used the molecular Signatures Database (MSigDB v7.0), hallmark gene sets with clusterProfiler and fgsea packages in R, with the biomaRT package in R to convert mouse gene IDs to human homolog associated gene symbols. e Venn diagrams demonstrate the overlap between the proteome of mouse MBC and human spindle MBC tumors, relative to their normal tissue counterparts, identifying a 17-protein upregulated and 19-protein downregulated protein set. Protein–protein interaction networks of up- and downregulated signatures highlight potential markers of interest, along with functional enrichment analysis using STRING v11.0. Color scheme of network proteins are matched by the legend of GO enrichment terms in barplots.

