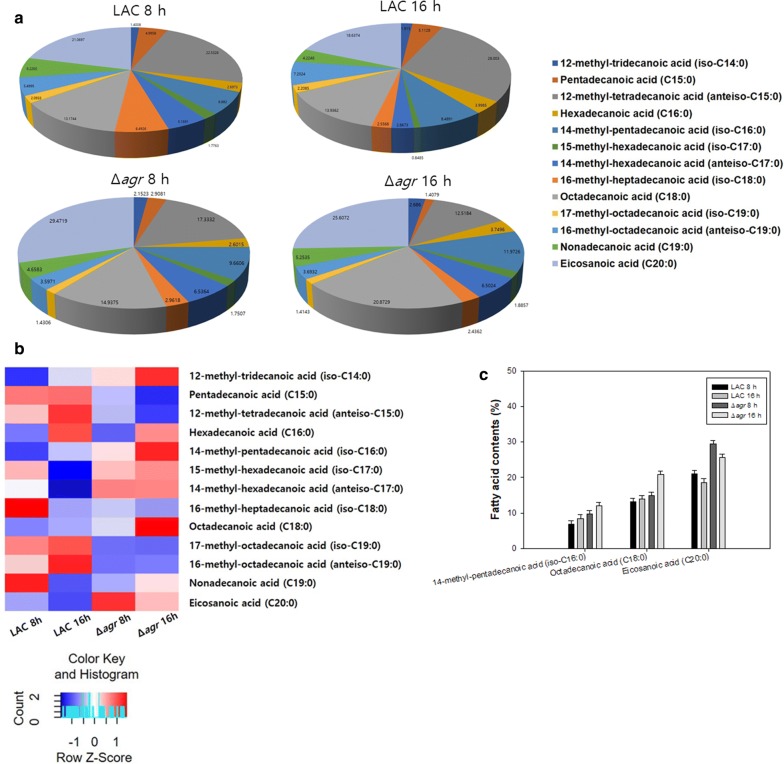
Fig. 3.
Comparison of phospholipid fatty acids in the LAC and Δagr mutant strains. a Compositional analysis of membrane fatty acids at different time points shown as a pie chart. b Compositional analysis of membrane fatty acids at different time points shown as a heatmap. c Fatty acid contents of 14-methyl-pentadecanoic acid (iso-C16:0) and octadecanoic acid (C18:0) in MRSA. The error bars represent the standard deviation of three replicates

