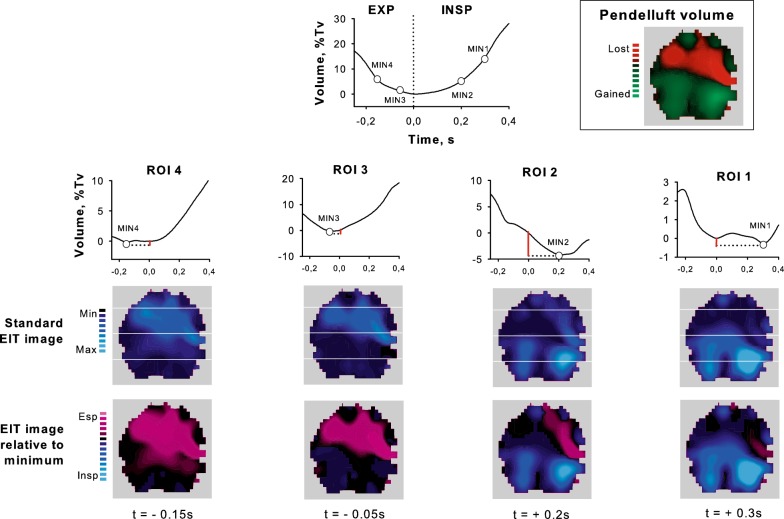
Fig. 5.
Pendelluft measurement and distribution in patient of the high-pendelluft group (single breath, unfiltered signal) due to early inflation of the dorsal regions and late deflation of the ventral ones. Minimum impedance values of the dorsal regions of interest (ROI 3 and 4) occurred during expiration (EXP), while in the ventral ones (ROI 1 and 2) occurred during inspiration (INSP). Total pendelluft volume was calculated as the sum of the volumes (red bars) inflated during expiration (ROI 3 and 4) and deflated during inspiration (ROI 1 and 2). Processed EIT imaging (relative to minimum) indicated that inspiration in the dorsal ROIs started when ventral ones were still expiring (expiration in purple color); the phenomenon was not immediately evident with standard EIT imaging. Pendelluft gas moved from the ventral towards the dorsal lung regions (boxed image)

