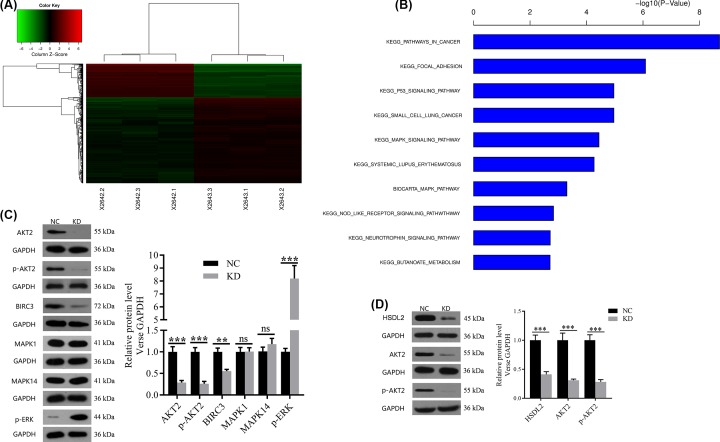
Figure 6. Effect of HSDL2 KD on mRNA expression profile and downstream proteins expression in H1299 cells.
(A) The graph of KD group and NC group which were clustered by using the expression profile of differential genes screened with fold change > 1.5 and FDR < 0.05 as standard. In the cluster analysis graph, each column represented a sample (X2642.1-3 represented the three replicate groups of NC, X2643.1-3 represented the three replicate groups of KD), each row represented a differential gene; the upper tree structure was based on the expression profile of the differential genes, aggregation or classification of all samples; the left tree structure represented the difference of genes. Red color indicates the relative increase in gene expression, green color indicates that gene expression is relatively down-regulated, black color indicates no significant change of gene expression, and gray color indicates that the signal intensity of the gene is not detected. (B) The significant enrichment of the differentially expressed genes in disease and function. The abscissa is the path name, and the ordinate is the level of significance of enrichment (base 10 negative logarithmic transformation). (C) The effects of siHSDL2 on the protein expression levels of potential downstream genes of HSDL2 in H1299 cells detected by Western blot. (D) The effects of siHSDL2 on AKT2 protein expression and its phosphorylation in H1688 cells detected by Western blot. GAPDH was used as an internal control in the Western blot analysis. NC: transfected with empty vector, KD: transfected with HSDL2 shRNA vector. ns, no significance; **P<0.01, ***P<0.001. Data are presented as mean ± SD from three independent experiments.

