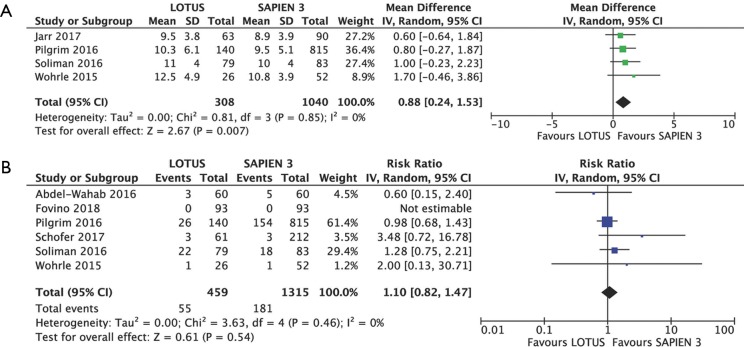
Figure 5.
Detailed analysis of individual weighted mean differences (MDs) with corresponding 95% CIs on postoperative mean aortic gradient for the comparison of Lotus vs. Sapien 3 (A) and individual and summary risk ratios with corresponding 95% CIs in the analysis of prosthesis-patient mismatch (B). 95% CI, 95% confidence interval; SD, standard deviation.

