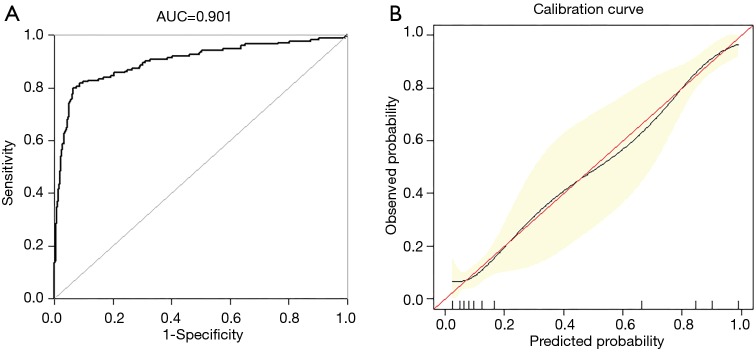
Figure 3.
Internal validation of nomogram in the training set. (A) Discrimination: AUC of the ROC curve was 0.901 (95% CI, 0.869–0.933). (B) Nomogram calibration curve. The red line indicates perfect prediction by an ideal model. The black line depicts the model’s performance. ROC, receiver operating characteristic; AUC, area under the curve.

