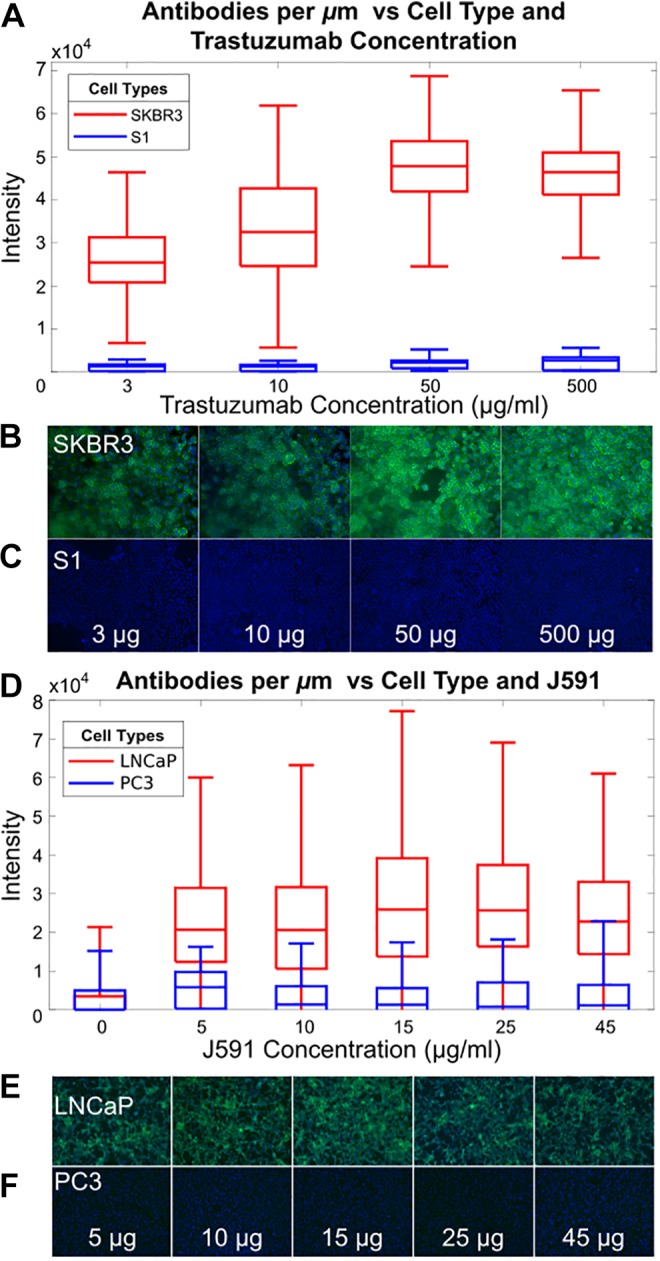
Figure 2.

Quantification of signal and noise in vitro. A, Quantification of trastuzumab binding to SKBR3 (HER2+) cells shows average of 30 to 50 000 antibodies/μm2, while S1 (HER2-) cells are ×17 less. B, Cell staining of SKBR3 and (C) cell staining of S1 with trastuzumab (green = trastuzumab, blue = nucleus) with various concentrations of anti-HER2 antibody. D-F, Similar experiment with prostate cancer cell line LNCaP (PSMA+) and PC3 (PSMA-). D, Quantification of J591 binding to LNCaP cells shows 40 000 antibodies/μm2. (E and F) Cell staining with J591 (green = J591, blue = nucleus) with various concentrations of J591 with LNCaP and PC3, respectively.
