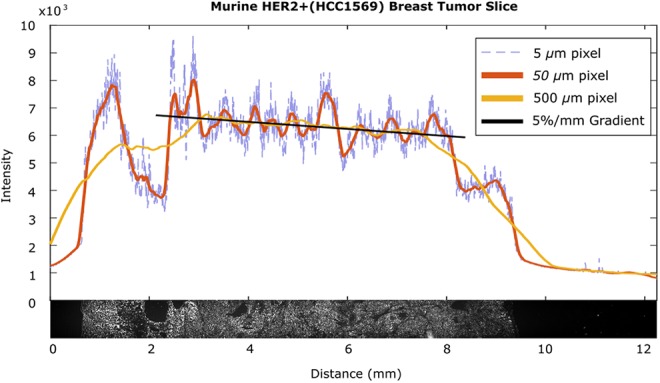
Figure 4.

Low-frequency spatial variations in a tumor slice. A section of HER2+ (HCC1569) tumor alongside line scans at various spatial resolutions demonstrates the heterogeneities that make determining background difficult. The 5-µm pixel information demonstrates high-frequency variation between cells, the 50-µm pixel information demonstrates the background variation due to tissue physiology and the linear portion of the 500-µm pixel information between 3 mm and 7 mm demonstrates a 5%/mm gradient likely due to diffusion
