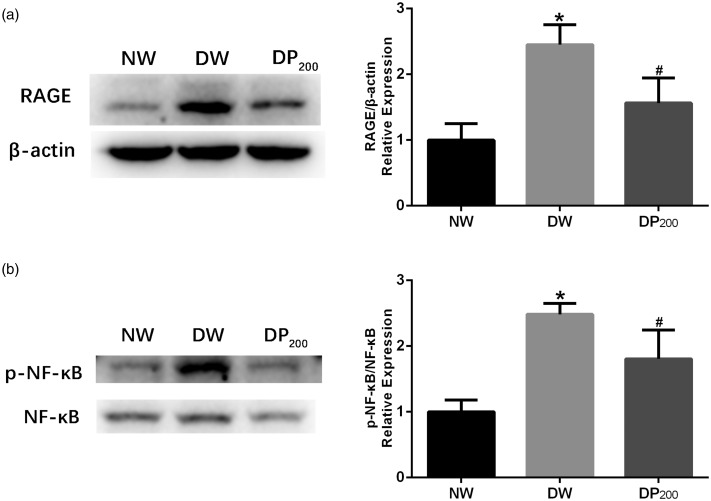
Figure 3.
Expression of RAGE/NF-κB in the three groups. (a) Representative western blots and statistical graphs showing the RAGE protein levels in the SDH of rats in the three groups. (b) Representative western blots and statistical graphs showing the expression of p-NF-κB in the SDH of rats in the three groups. The band densities were normalized to those of the NW group. *P < 0.05 vs. the NW group, #P < 0.05 vs. the DW group. N = 5 per group.

