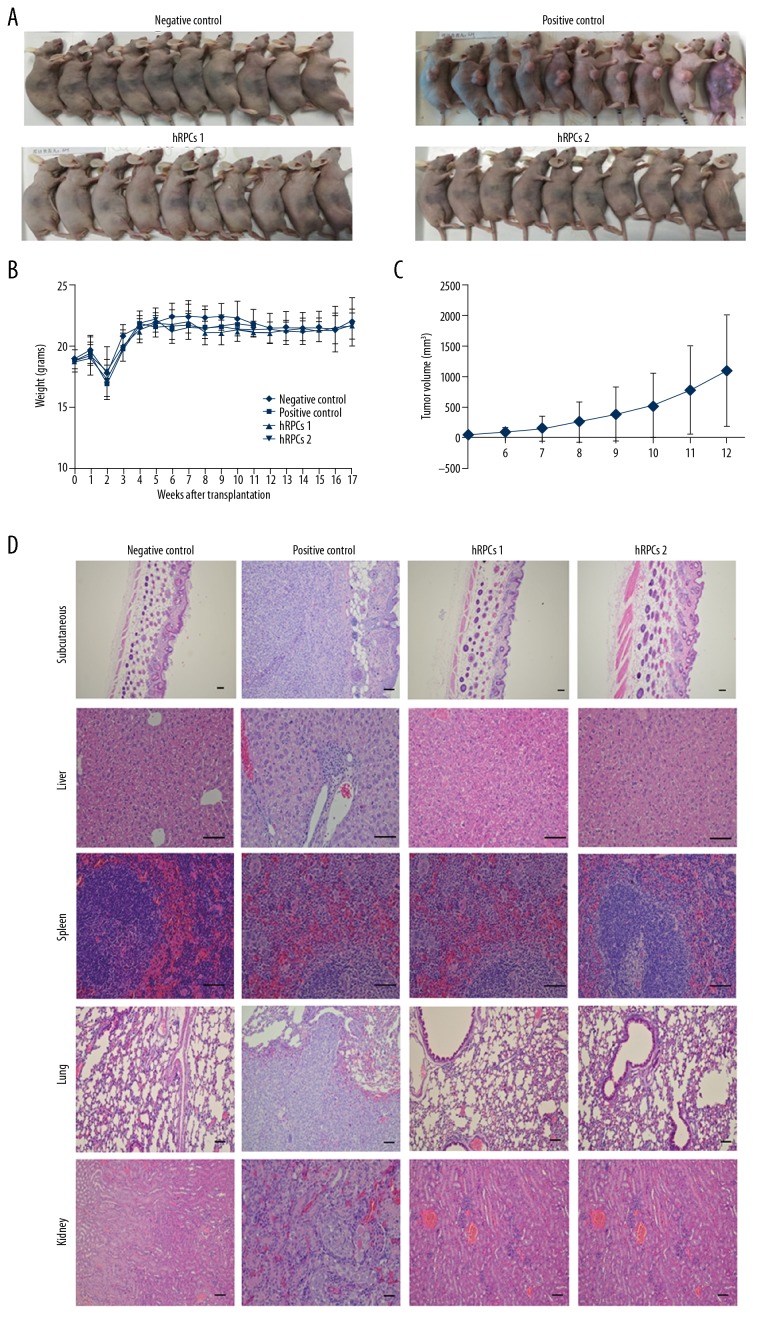
Figure 2.
The hRPCs injection groups were unable to develop teratoma. (A) Teratoma formation in BALB/c-nu mice (n=10) at 16 weeks after cell transplantation. (B) Weight change curves of animals in different groups. (C) Tumor size was monitored weekly when the tumor growth became visible. The graph represents the tumor growth volume observed in the positive control group at different time points before tumor resection. (D) Hematoxylin and eosin (H&E) staining of different sections of the animals in different groups. hRPCs in passage 6 and passage 12 had no subcutaneous, liver, spleen, lung, or kidney tumor formation, which was the same as in the negative control group, but the positive control group had tumor formation at these sites. Scale bars: 50 μm.

