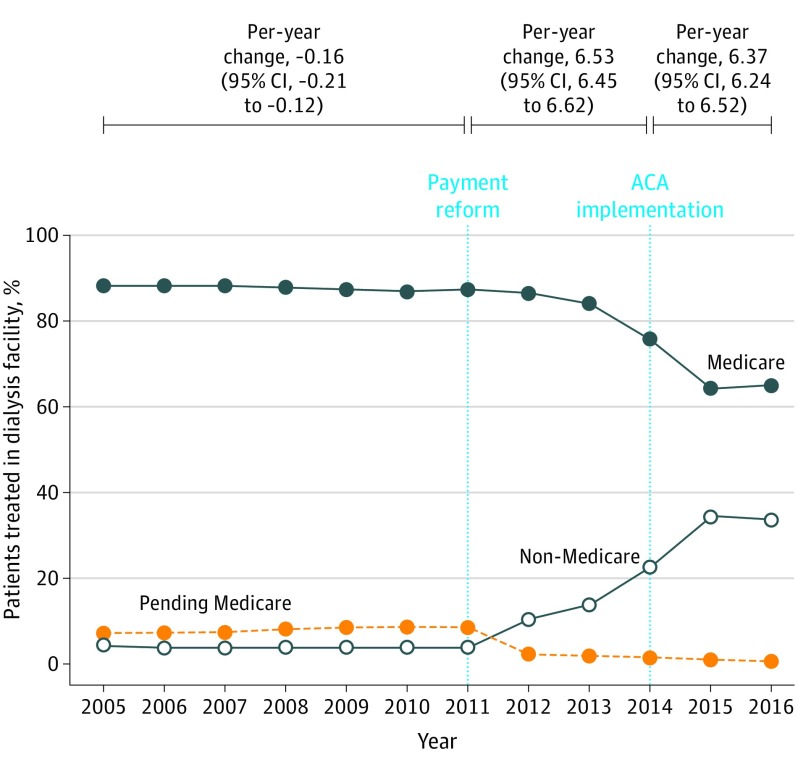
Figure 1. Annual Change in Medicare and Non-Medicare Enrollment Reported by Dialysis Facilities, 2005-2016.
The data points represent the mean percentage of patients at dialysis facilities; the annual change (95% CI) represents patients with non-Medicare coverage. Direct tests of differences between periods indicated that the growth in non-Medicare coverage was statistically significantly different between 2011-2014 and 2005-2011 (6.70 percentage points; 95% CI, 6.58-6.81), but not between 2014-2016 and 2011-2014 (–0.16 percentage points; 95% CI, –0.36 to 0.04). The slopes were generated using a generalized least-squares model with random effects, linear splines, and adjustment for facility-level characteristics (profit status, membership in 2 of the largest chains) and hospital referral region characteristics (US region, competition [Herfindahl Index], percentage of patients aged <65 years with end-stage kidney disease). ACA indicates Affordable Care Act.

