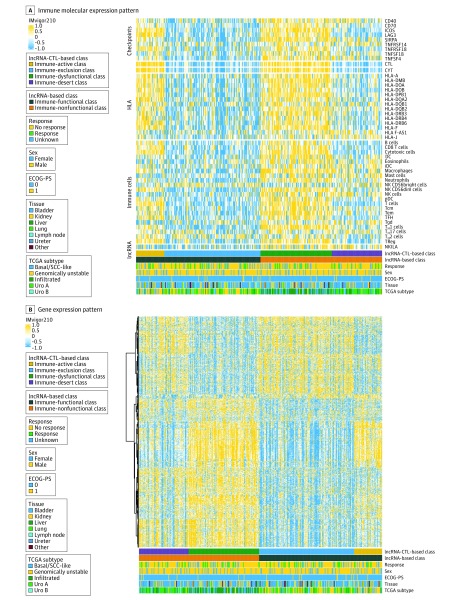
Figure 4. Heatmap Representation of the Immune Molecular and Gene Expression Patterns.
CTL indicates cytotoxic T-lymphocyte; CYT, cytolytic activity; DC, dendritic cell; ECOG-PS, Eastern Cooperative Oncology Group Performance Status; IDC, immature dendritic cell; lncRNA, long noncoding RNA; NK, natural killer; pDC, plasmacytoid dendritic cell; SCC, squamous cell carcinoma; TCGA, The Cancer Genome Atlas; Tcm, central memory T cells; Tem, effector memory T cells; TFH, T follicular helper cells; TReg, T regulatory cells; Uro A, urothelial-like A subtype; and Uro B, urothelial-like B subtype. The black lines at the y axis of panel B indicate the unsupervised hierarchical clustering of genes.

