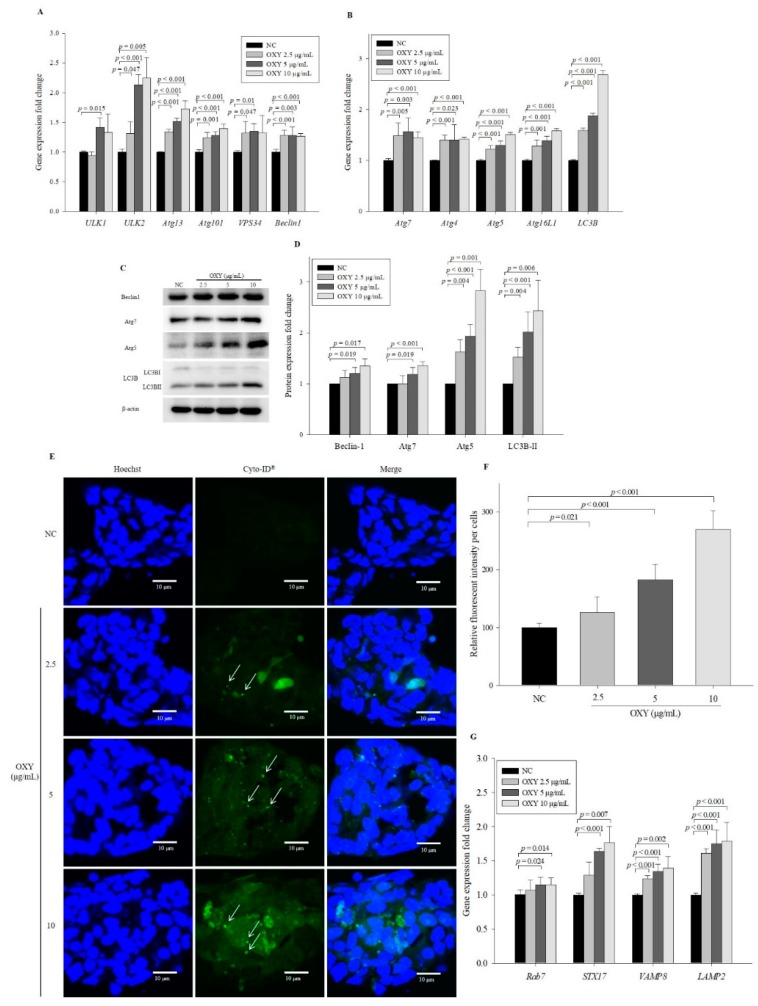
Figure 3.
Effect of OXY on the expression levels of autophagy-related genes and proteins. Expression levels of genes related to phagophore formation were quantified by qPCR (A). Expression levels of autophagosome elongation-related genes were quantified by qPCR (B). Expression levels of autophagosome formation-related proteins were measured by Western blotting (C) and quantified (D). From each lysate, equal amounts of protein were loaded on a separate gel, blotted for actin and this signal was used for determining the ratio of the protein of interest/actin as displayed in the figure. The cropped blots are representative of three independent experiments. The full-length blots are shown in Supplementary Figure S2. The effect of OXY on autophagic vesicle formation was measured by staining with a fluorescence dye using a CYTO-ID autophagy detection kit; white arrows indicate autophagosomes (magnification 600×) (E), which were quantified (F). Expression levels of autolysosome formation-related genes were quantified by qPCR (G). Each value indicates the mean ± SD of three independent experiments performed in triplicate.

