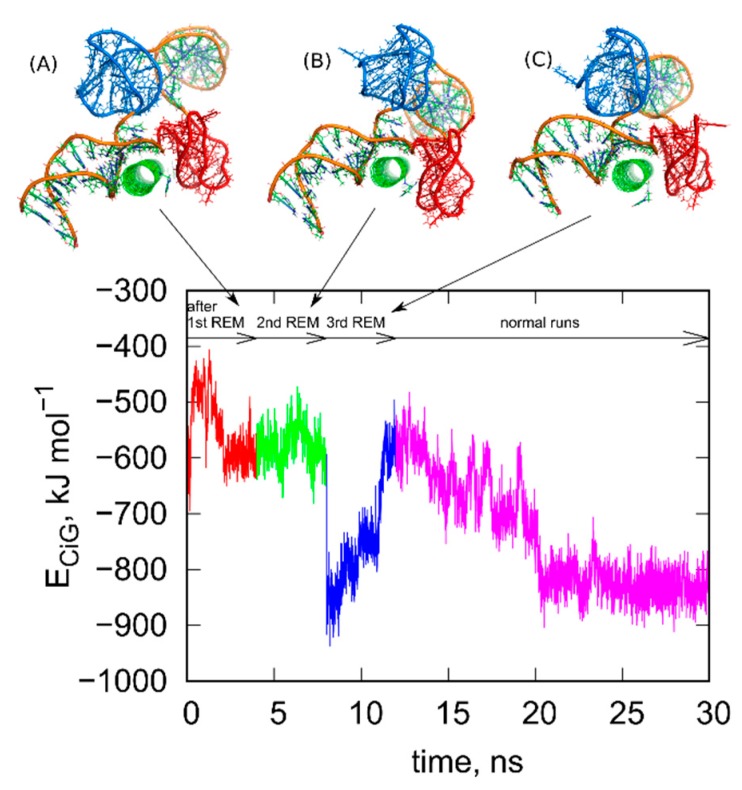
Figure 3.
Changes of the ECiG energy after successive rigid body replica exchange (rbREM) calculations. The curve is divided into several sections corresponding to normal unbiased all-atom runs but interrupted by the rbREM periods. Each rbREM stage was done between time sections denoted by the short arrows. The snapshots (A–C) show system configurations found at the time points corresponding to the end of each short arrow. These configurations are available in the supplementary material as pdb files, files fig_3A-C.pdb.

