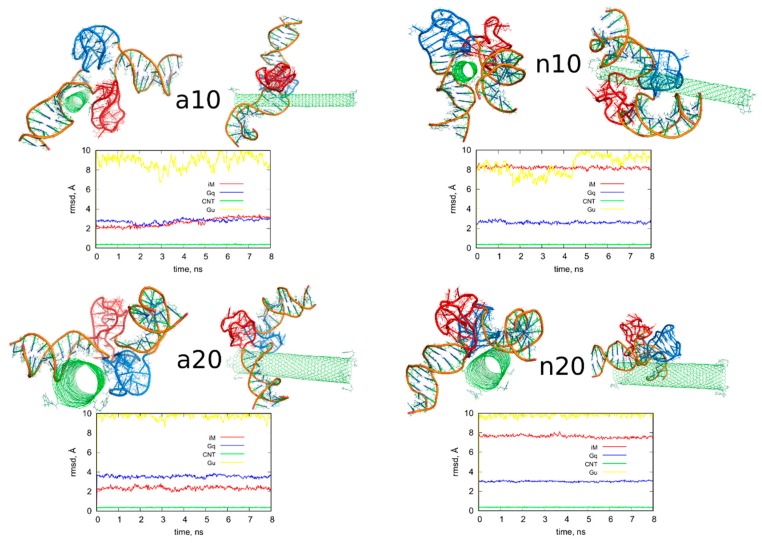
Figure 4.
Simulation snapshots of the determined optimal configurations of fCNT and iG compounds and rmsd plots determined from the last 8 ns of simulations for iM, Gq, bare CNT and guanine functional groups (Gu). The G-quadruplexes are in blue color while i-motifs are in red color. Each of these configurations is available in the supplementary material as pdb files, files fig4_a10.pdb, fig4_a20.pdb, fig4_n10.pdb, fig4_n20.pdb.

