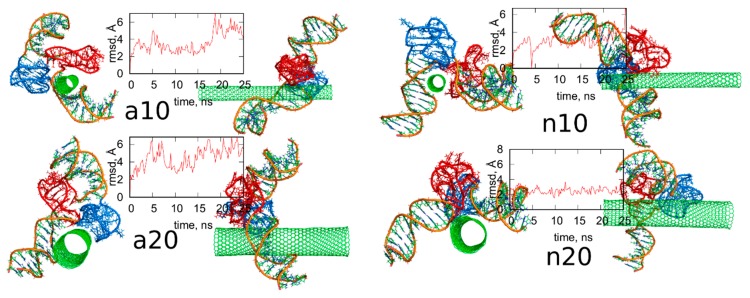
Figure 7.
Simulation snapshots of the systems from Figure 4 after removal of guanine functional groups from fCNT and the rmsd plots of iG parts calculated for the next 25 ns of simulations. The reference configurations for calculation of rmsd were just the structures from Figure 4. The snapshots taken at the very last simulations timesteps. Each of these configurations is available in the supplementary material as pdb files, files fig7_a10.pdb, fig7_a20.pdb, fig7_n10.pdb, fig7_n20.pdb.

