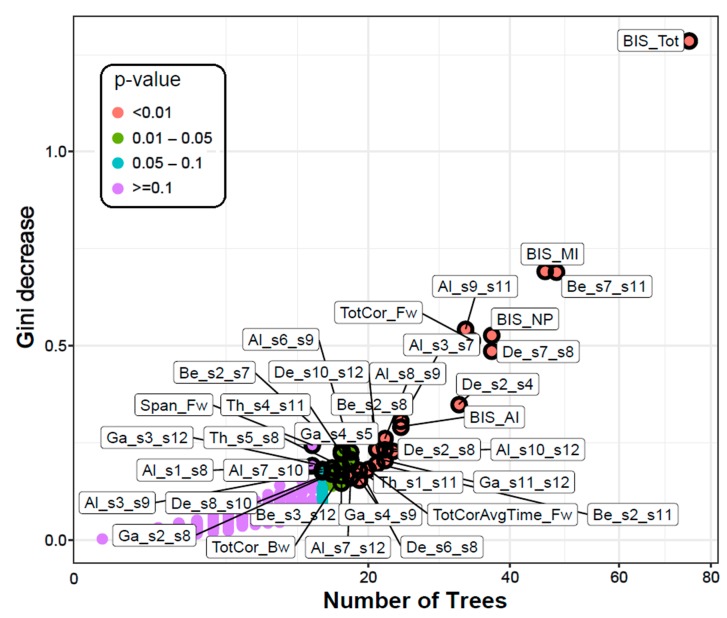
Figure 2.
The multi-way importance plot showing the top significant variables (labelled and marked with black circles) that contributed to the classification of alcohol use disorder from control individuals based on the measures Gini decrease, number of trees, and p-value. All 4 impulsivity scores, 29 FC connections, and 3 neuropsychological variables were significant (circled and labelled red and gray dots). Impulsivity scores stood on top in the importance list. Note that the variables that were not significant or important (purple dots) are not highlighted. [Abbreviations in the FC variable labels: BIS–Barratt Impulsivity Scale; MI–Motor impulsivity; NP–Non-planning; AI–Attentional impulsivity; Tot–Total; Span_Fw–Span forward; TotCor_Fw–Total correct forward; TotCorAvgTime_Fw–Total correct average time forward; TotCor_Bw–Total correct backward; De–Delta; Th–Theta; Al–Alpha; Be–Beta; Ga–Gamma; s1-s12–default mode network (DMN) seeds 1-12 as listed in Table 2].

