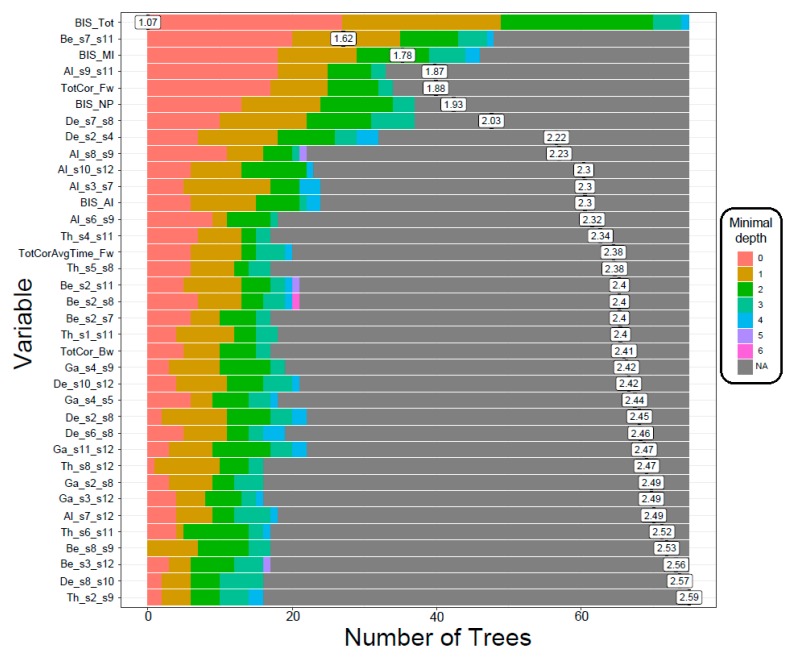
Figure 3.
The distribution of minimal depth among the trees of the forest for the significant variables is shown in different colors for each level of minimal depth. The mean minimal depth in the distribution for each variable is marked by a vertical black bar overlapped by a value label inside a box. Lower mean minimal depth of a functional connectivity variable represents higher number of observations (participants) categorized in a specific group on the basis of the variable (i.e., better classification). The top significant variables (29 functional connectivity connections, 3 neuropsychological scores and all 4 impulsivity scores) followed the same rank in the plot as in Table 3, which is ordered based on p-values. [Abbreviations in the FC variable labels: De–Delta; Th–Theta; Al–Alpha; Be–Beta; Ga–Gamma; s1-s12–default mode network (DMN) seeds 1-12 as listed in Table 2].

