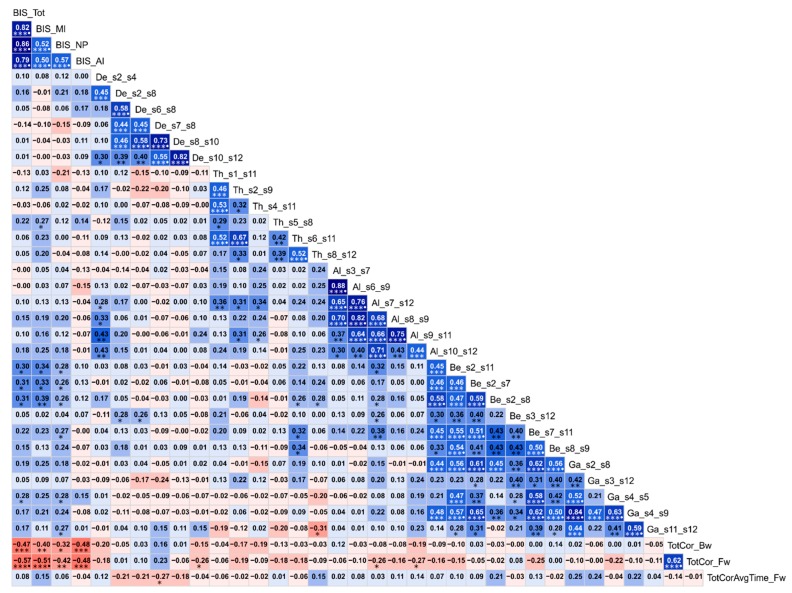
Figure 7.
Correlation matrix showing associations among the top significant variables based on explorative (descriptive) correlational analysis for the interpretative purpose. Values within each cell represents bivariate Pearson correlation between the variable on its vertical axis and the variable on its horizontal axis. Correlation values are color coded [red/pink shades represent negative r-values, blue/cyan shades indicate positive r-values, darker color represent higher magnitude] and significant correlations (before Bonferroni correction) have been marked with asterisks [*p < 0.05; **p < 0.01; and ***p < 0.001]. The correlations that survived Bonferroni correction (r ≥ 0.50 and p < 0.00005) have been marked with a filled circle at the end of triple asterisks (***●). Abbreviations in the variable labels: De–Delta; Th–Theta; Al–Alpha; Be–Beta; Ga–Gamma; s1-s12–default mode network seeds 1-12 as listed in Table 2.

