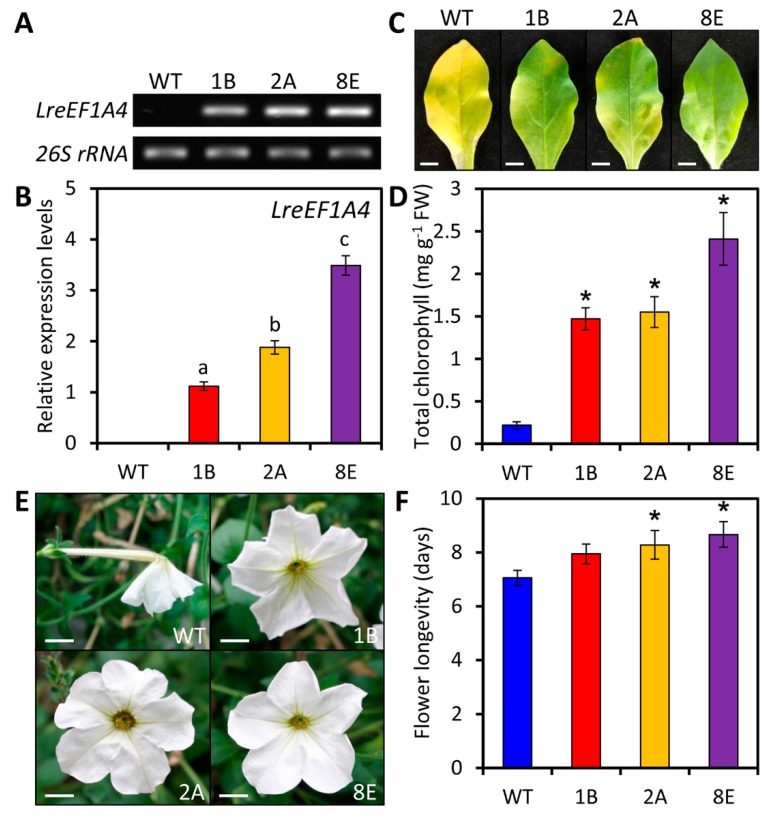
Figure 4.
Delayed leaf and flower senescence in transgenic petunia plants overexpressing LreEF1A4. Semi-quantitative reverse transcription-polymerase chain reaction (RT-PCR) (A) and quantitative real-time PCR (B) analyses of LreEF1A4 expression levels in the leaves of wild-type (WT) and LreEF1A4-overexpressing transgenic petunia lines (1B, 2A, and 8E). 26S rRNA was used as a reference gene. Representative phenotypes (C) and total chlorophyll content (D) of the leaves at the bottom of 8-week-old WT and transgenic lines. Scale bars = 1.0 cm. Representative phenotypes of attached unpollinated flowers at 8 days after anthesis (E) and longevity of flowers (F) from WT and transgenic petunia plants. Scale bars = 1.0 cm. Error bars represent standard error (SE) of the mean from three independent biological replicates. Significance of difference was determined using one-way analysis of variance (ANOVA) test (p < 0.05) and shown as various letters, or using Student’s t-test (p < 0.05) and marked by asterisks.

