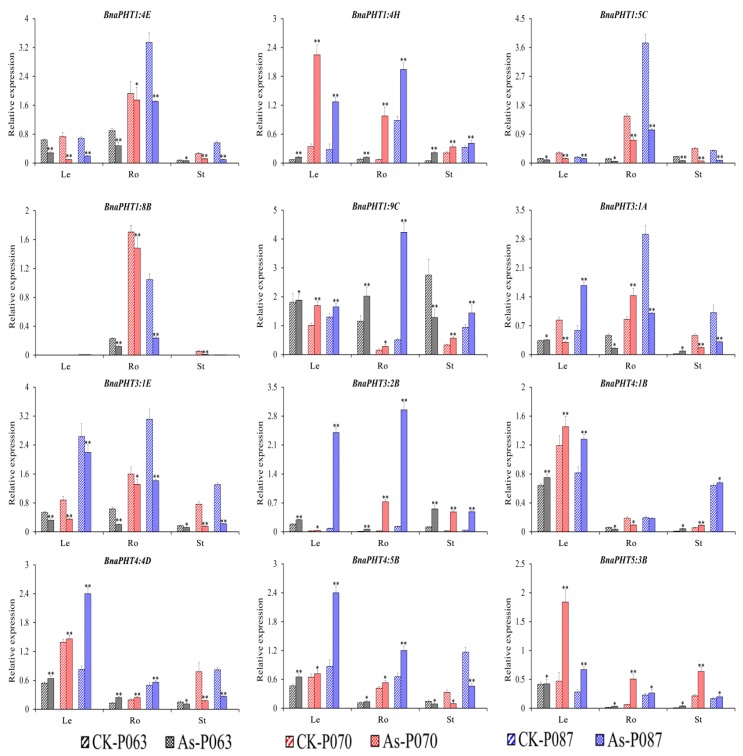
Figure 7.
Expression profiles of 12 BnaPHT genes in B. napus under As3+ treatment, as revealed by qRT-PCR. The CK is the control sample, and As represents samples treated with As3+ stress. The samples (P063, P070, and P087) are B. napus accessions. Error bars show the standard deviation of three biological replicates. Single and double asterisks represent significant differences from the control sample at the 0.05 and 0.01 levels (t-test), respectively.

