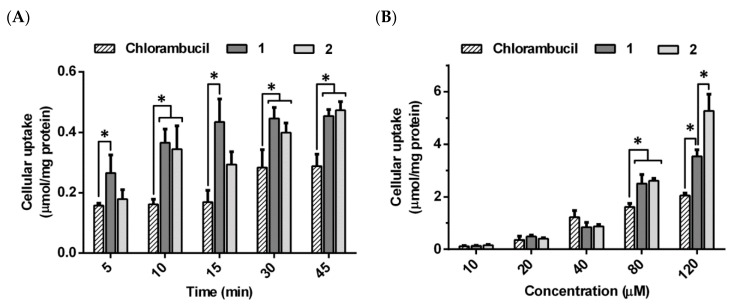
Figure 4.
Cellular uptake of chlorambucil and its derivatives 1 and 2 at different incubation times (20 µM) (A) and different concentrations (15 min) (B) in MCF-7 cells. Values expressed as mean ± SD (n = 3). * p < 0.05, significant difference compared to chlorambucil at relevant times and concentrations.

