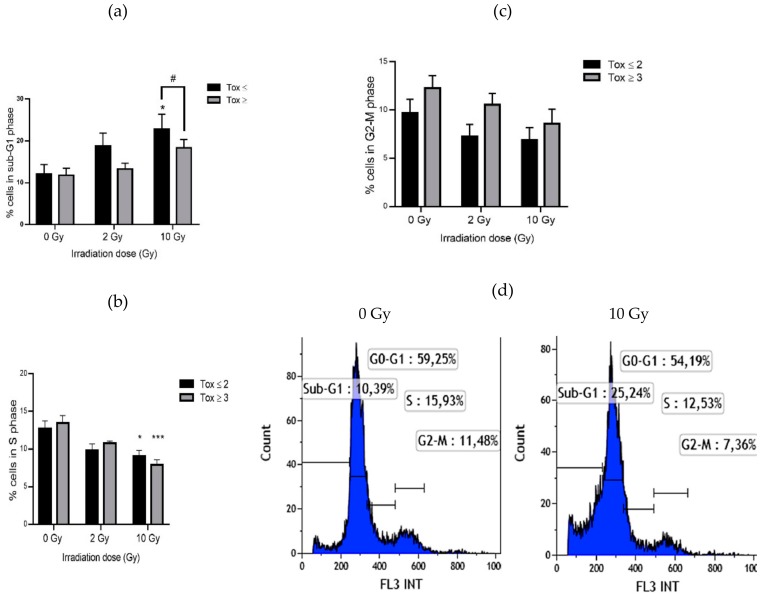
Figure 2.
Lymphocyte percentage in sub-G1 phase (a), in S phase (b) and in G2-M phase (c) in both groups of patients and example of analysis of cell cycle for one patient (d). Groups Tox ≤ 2 and Tox ≥ 3 correspond to patients presenting grade 2 or less and grade 3 or more of late skin reactions after RT according to RTOG/EORTC, respectively. * for p < 0.05 and *** for p < 0.0001 for irradiated samples compared to non-irradiated ones and # for p < 0.05 for Tox ≥ 3 compared to Tox ≤ 2 group.

