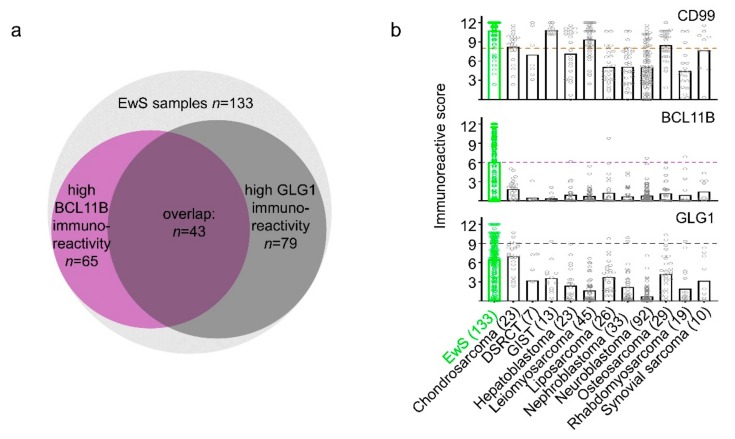
Figure 2.
High immunoreactivity for BCL11B and GLG1 is diagnostic for EwS in CD99 positive samples. (a) Venn diagram representing all EwS samples in the TMA cohort of this study, the BCL11B and GLG1 high-expressing samples (at least 60% tumor cells stained, at least intermediate intensity) and their overlap. (b) Dot-plots indicating IRS values for CD99, BCL11B, and GLG1 in EwS and 11 differential diagnoses. The number of samples per entity is given in brackets. Bars indicate mean IRS; dashed lines indicate optimal cut-offs.

