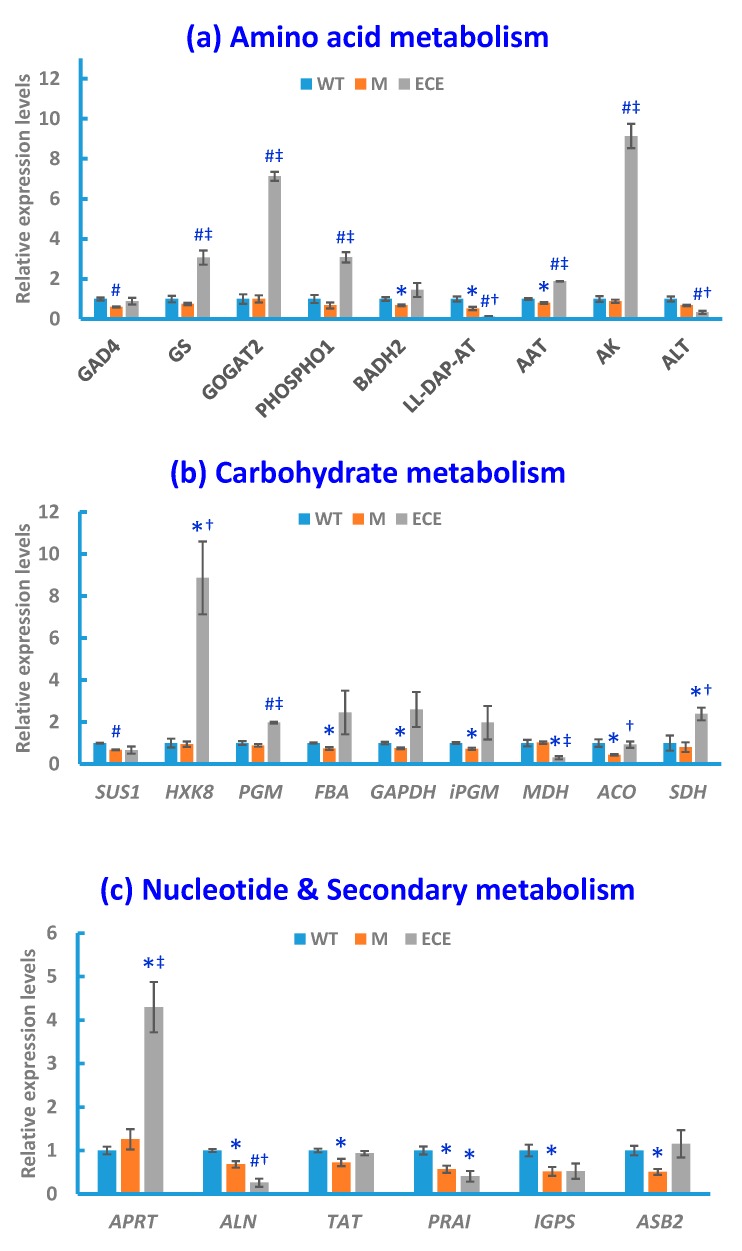
Figure 4.
Gene expression levels in the wild-type (WT, blue bars), the oscyp96b4 semi-dwarf mutant (M, orange bars), and the OsCYP96B4 ectopic expression (ECE, grey bars) rice lines measured by qRT-PCR. Data shown are means ± SE of three biological replicates each with three technical replicates (* p < 0.05, #P < 0.01, as compared to WT; † p < 0.05, ‡ p < 0.01, as compared to M).

