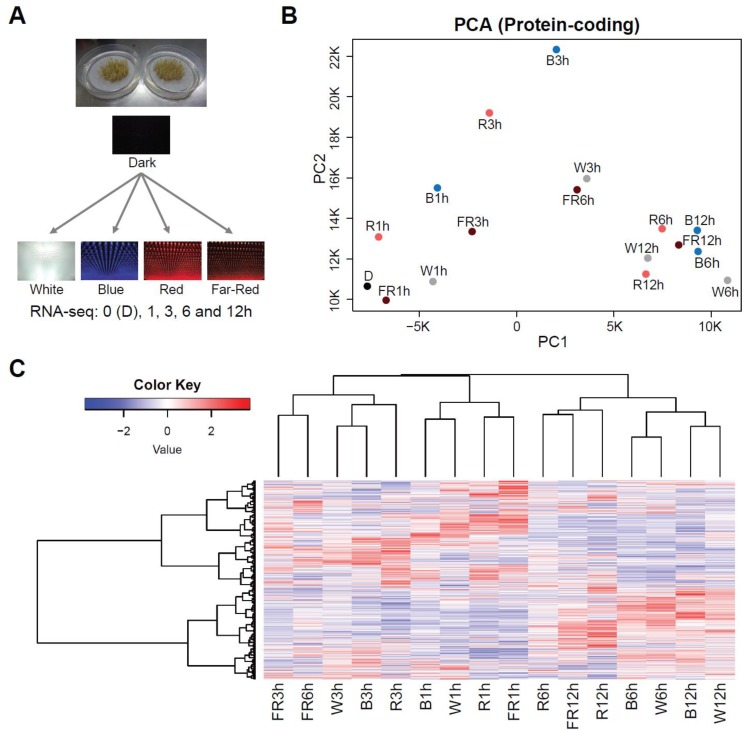
Figure 1.
Time-course transcriptome analyses after light exposure from darkness. (A) Schematic explanation of the experiments performed in this research. Seedlings grown in the dark for 3 days were exposed to white, blue, red, or far-red light. RNA-seq analyses were performed at 0, 1, 3, 6 and 12 h after light exposure. (B) Principal component analysis for mRNA accumulation on exposure to light. W = White, B = Blue, R = Red, FR = Far-Red. (C) Heatmap (Z-score data) of fold changes (light/dark) of mRNAs that were detected by the time-course RNA-seq analysis.

