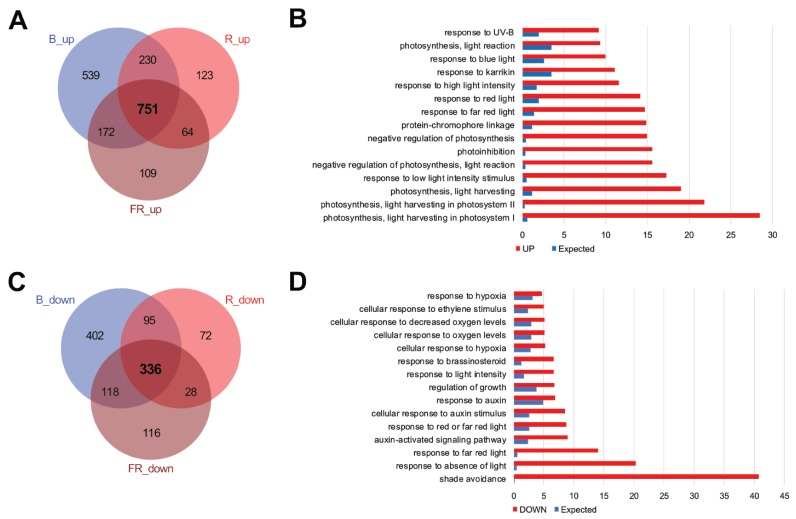
Figure 2.
Comparison of differentially expressed genes (DEGs) in seedlings after the blue, red, and far-red monochromatic light irradiation. (A) and (B) Overlaps of up-regulated (A) and down-regulated (B) genes after the different monochromatic light irradiations. (C) and (D) Gene ontology (GO) term enrichments of up-regulated (C) or down-regulated (D) genes after the different monochromatic light irradiations. DEGs were derived from either 1 h or 3 h light exposures in RNA-seq analysis.

