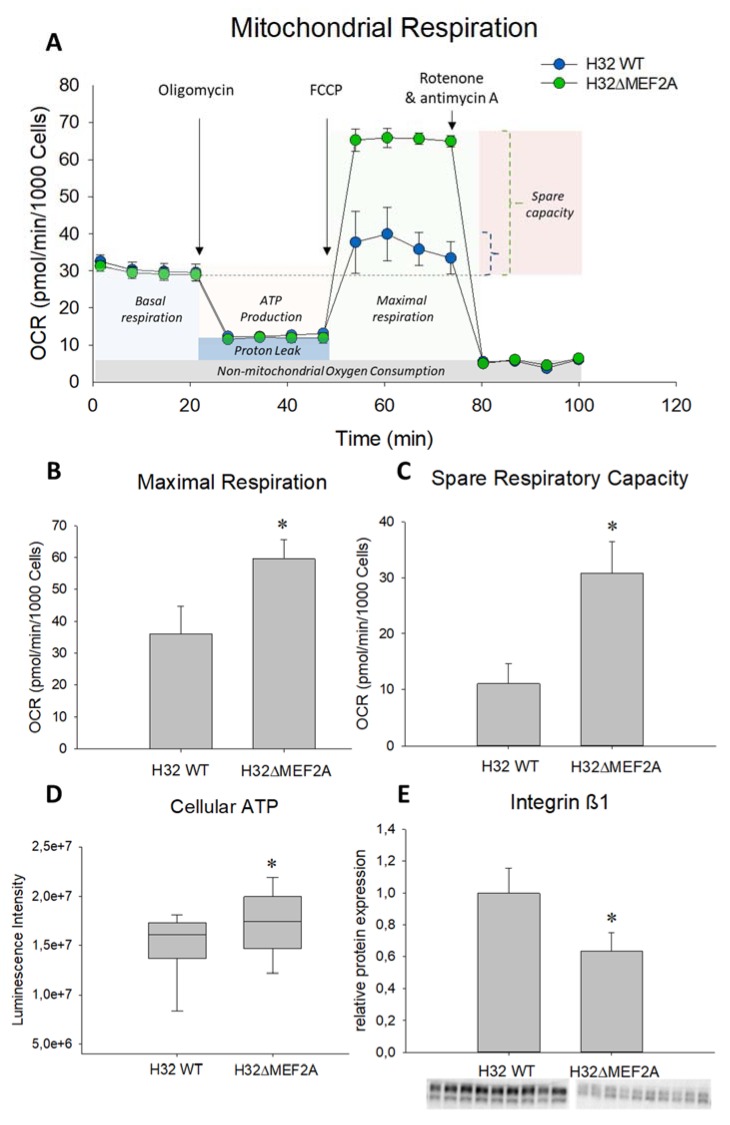
Figure 4.
Effect of MEF2A knockout on mitochondrial function and neuronal connectivity. (A) The Agilent Seahorse XF Cell Mito Stress Test profile shows the oxygen consumption rate (OCR) in H32 wild-type (WT) and H32ΔMEF2A cells representing key parameters of mitochondrial function. (B) and (C) The OCR of both cell lines in the mitochondria stress test measured by Seahorse. H32ΔMEF2A cells show a significantly increased maximal respiration (* p = 0.004) and spare respiratory capacity (maximal vs. basal respiration, * p = 0.01) compared to H32 cells. n = 3 test repetitions with 4 measurement replicates per group. (D) Cellular ATP content under basal conditions is significantly higher in H32ΔMEF2A than H32 WT cells. n = 24 per group; * p = 0.038. (E) Relative protein expression of integrin ß1 is significantly downregulated in H32ΔMEF2A cells compared to H32 WT cells. n (H32 WT) = 9, n (H32ΔMEF2A) = 10; * p < 0.001.

