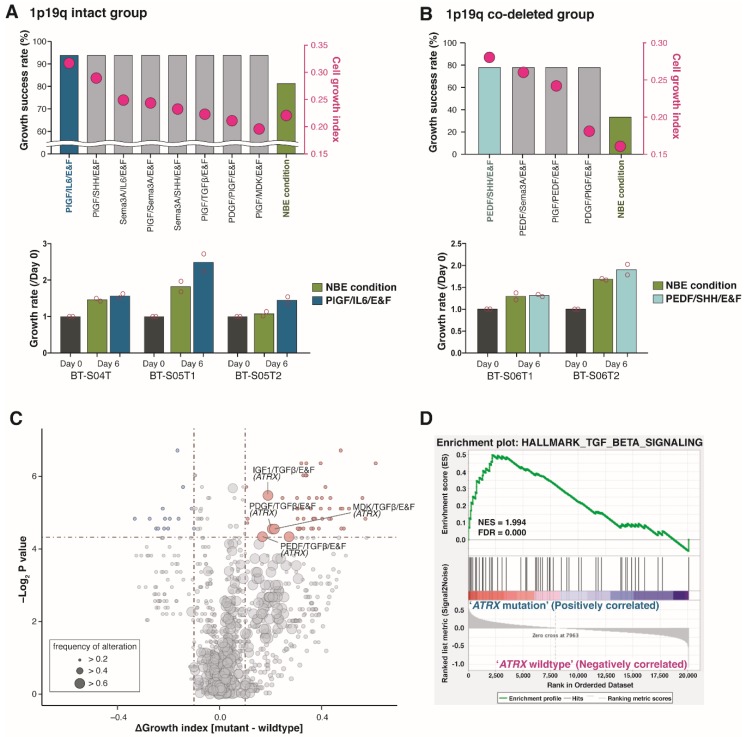
Figure 5.
Newly selected culture conditions for IDH1-mut DIGs. (A,B) The culture conditions with higher growth success rates than the NBE condition for the IDH1-mut and 1p19q intact cells (A) and IDH1-mut and 1p1/9q co-deleted cell (B) (upper panels). The bars and dots indicate growth success rates and cell growth indices, respectively. The culture condition with the highest growth success rate and highest cell growth index was validated in additional samples (lower panels). The dots represent the values from technical duplicates. (C) A volcano plot showing culture conditions with significant differences in cell growth indices between IDH1-wt and -mut GSCs for frequently mutated genes in DIGs. The X-axis represents the magnitude (cell growth index of IDH1-mut GSCs–that of IDH1-wt GSCs), and the Y-axis represents the significance (−log10(Wilcoxon rank-sum P-value)) of the association between mutations and culture conditions. Each circle represents a single mutation-culture condition interaction, and the size is proportional to the mutation frequencies. (D) The GSEA plot of transforming growth factor-beta (TGF-β)-associated gene set (HALLMARK_TGF_BETA_SIGNALING) between ATRX-mut and -wt GSCs in IDH1-mut DIGs from the TCGA LGG dataset.

