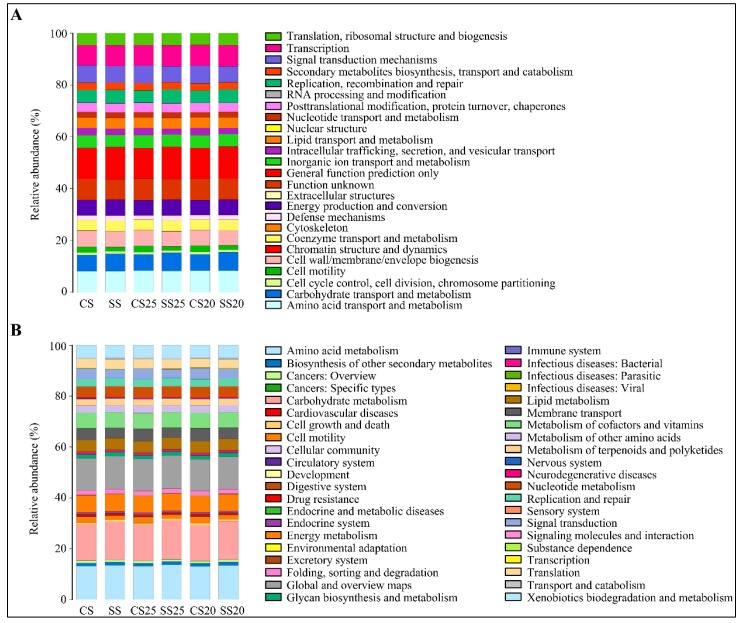
Figure 6.
Metabolic functional features of the peanut spermosphere bacterial community. (A) Bar chart showing the relative abundance and diversity of functional groups in various peanut spermosphere soil groups and bulk soil groups in the context of the Cluster of Orthologous Groups (COG) database. Different COG groups are displayed in different colors, as listed in the right. (B) The Kyoto Encyclopedia of Genes and Genomes (KEGG) database showing the relative abundance and diversity of functional groups in various peanut spermosphere soil groups and bulk soil groups.

