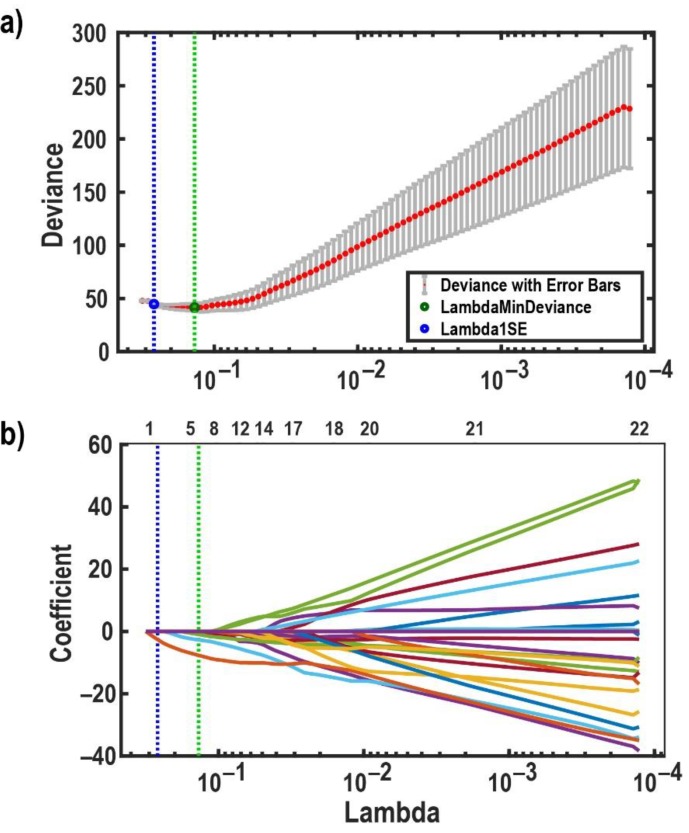
Figure 1.
Effects of LASSO regularization tuning parameter λ on regression coefficients, and deviances. (a) A plot of the cross-validation deviance of the LASSO fit model against the λ. This figure shows leave-one-subject-out cross-validation results to determine the optimal value of λ. The Y-axis indicates the cross-validation deviance corresponds to the values of λ on the X-axis. The mean cross-validation deviance is shown by the red points in this figure, and each error bar shows ±1 standard deviation. The blue and green vertical dotted lines (in both figures) indicate the λ, which gives the minimum deviance with no more than one standard deviation (blue circle) and the minimum deviance (green circle), respectively. (b) The paths of the LASSO fit model’s coefficients in dependence on λ. This figure shows how λ controls the shrinkage of LASSO coefficients. The numbers above the box show how many non-zero coefficients remain considering the corresponding λ values on the X-axis. The Y-axis illustrates the coefficients of classifiers. Each path refers to one regression coefficient. It is shown that when λ increases to the left side of the plot, the number of remaining non-zero coefficients gets close to zero.

