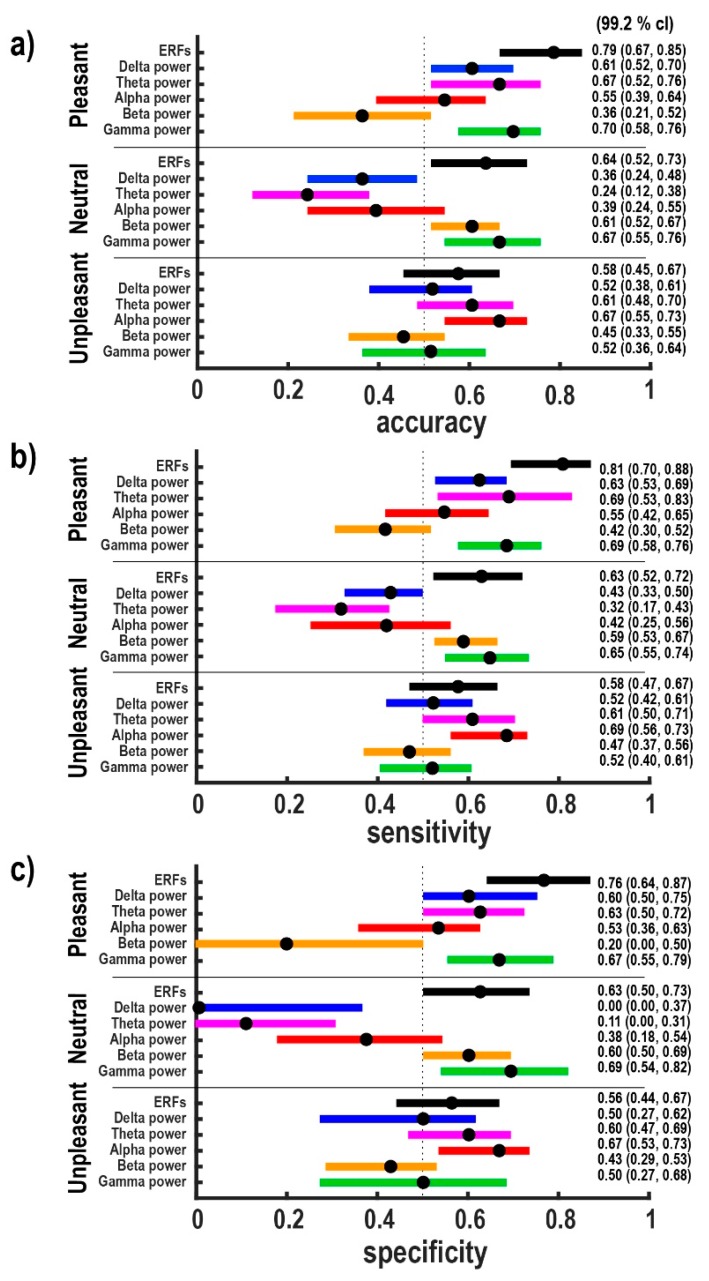
Figure 2.
Evaluation of classifier performance for all feature sets based on 1000 16-fold-stratified cross-validations. Numerical values represent medians as well as 95% simultaneous confidence intervals for the metrics (a) accuracy, (b) sensitivity, and (c) specificity. The median values considering 95% CI are represented by circles. The vertical dotted line displays results equal to random results. Considering features based on ERFs in the pleasant category, we achieved the highest classification performances.

