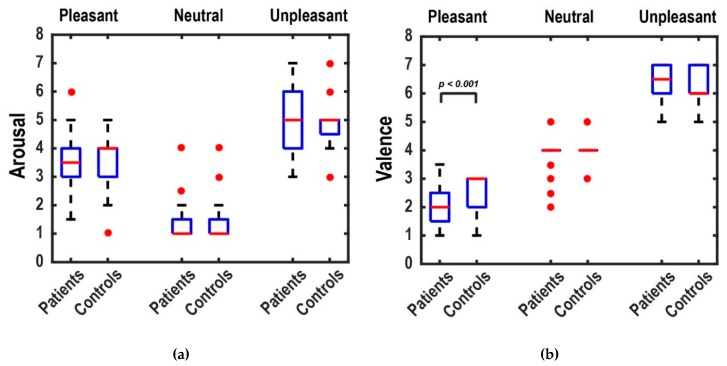
Figure 3.
Boxplots of the arousal (a) and valence (b) ratings of patients and healthy controls for each picture category. Boxplots show the median ratings of subjects for each picture category. The red lines are the medians, and the red circles represent outliers. The valence ratings for pleasant stimuli are significantly higher for healthy controls compared to patients.

