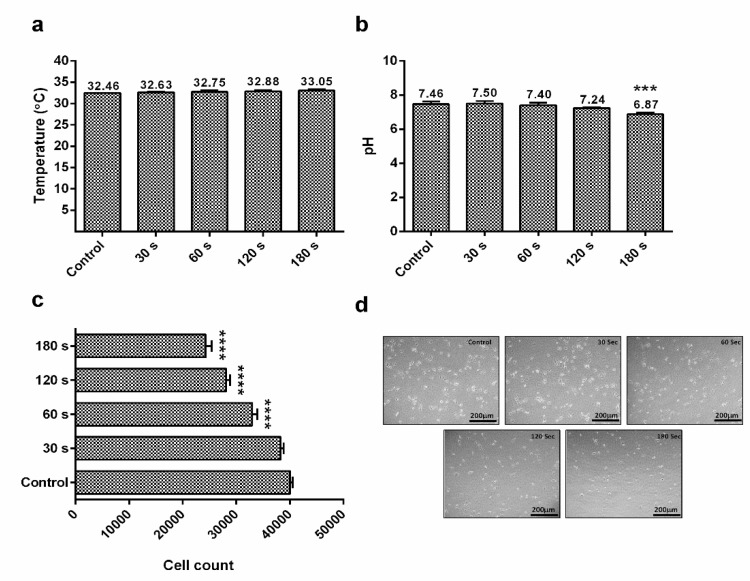
Figure 2.
(a) Estimation of temperature within cell media (RPMI-1640) after the exposure of air CAP at different time intervals; (b) effect of different CAP doses on the pH level of cell media; (c) assessment of the G-361 human melanoma cell count using a hemocytometer counter after the exposure of CAP at different time intervals; (d) microscopic evaluation of G-361 human melanoma cells at different CAP doses (scale bar = 200 μm). Data are the mean ± SE of three experiments. Statistical analysis was performed using a one-way ANOVA test followed by Dunnett’s test for comparisons. Each asterisk represents statistical differences between the treatment and control (*** p < 0.001 and **** p < 0.0001).

