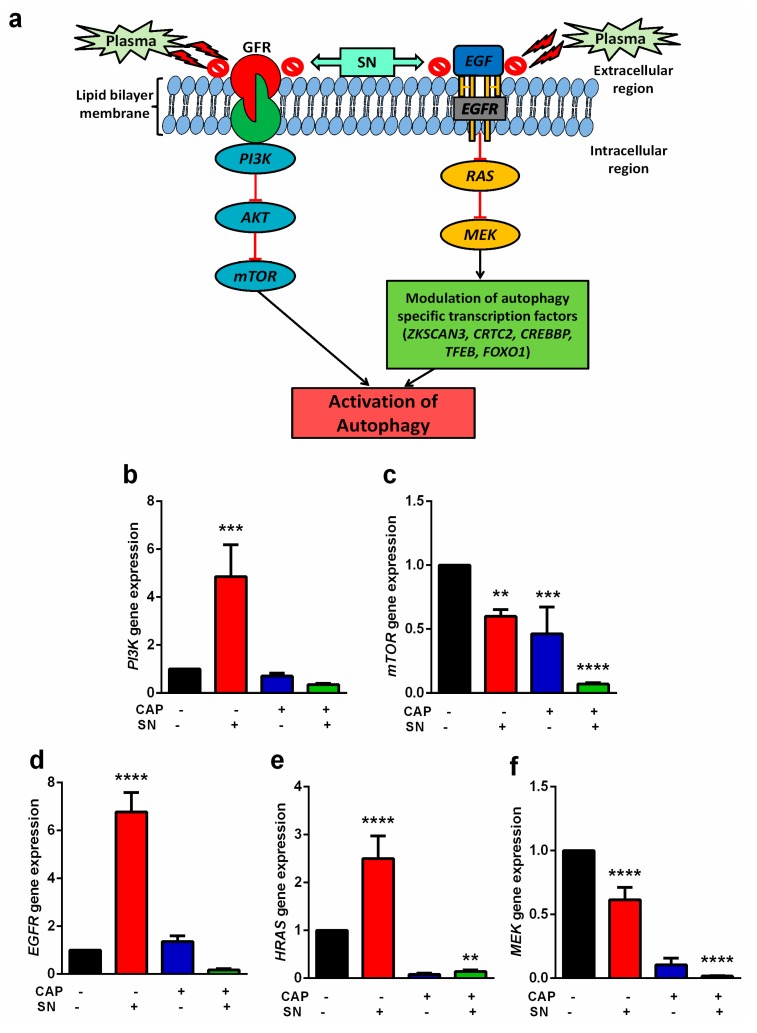
Figure 4.
(a) Illustration of the CAP and silymarin nanoemulsion (SN)-mediated hypothesis about the blockage of PI3K/AKT/mTOR and RAS/MEK pathways for the activation of autophagy. Gene analysis of the GFR-mediated downstream expression of the (b) PI3K gene and (c) mTOR gene, and gene analysis of the Epidermal Growth factor (EGF)-mediated downstream expression of the (d) EGFR gene, (e) HRAS gene, and (f) MEK gene. Data are the mean ± SE of three experiments. Statistical analysis was performed using a one-way ANOVA test followed by Dunnett’s test for comparisons. Each asterisk represents statistical differences between the treatment and control (** p < 0.01, *** p < 0.001, and **** p < 0.0001).

