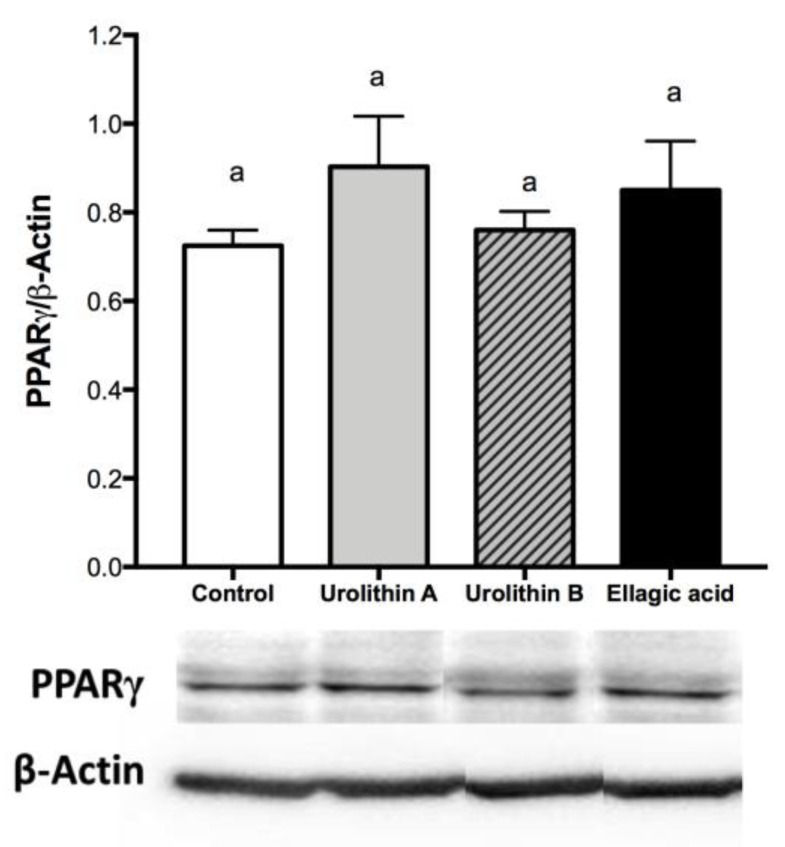
Figure 3.
Effect of ellagic acid, urolithin A, and urolithin B over PPARγ protein expression at day 4 after differentiation induction. 3T3-L1 cells were treated with 25 μM of each compound. For control samples, 0.025% DMSO was used. The values represent the mean ± SD (n = 3) of three independent experiments. Different letters among bars denote significant changes among treatments and control (p ≤ 0.05) performed by ANOVA and Tukey’s post hoc test.

