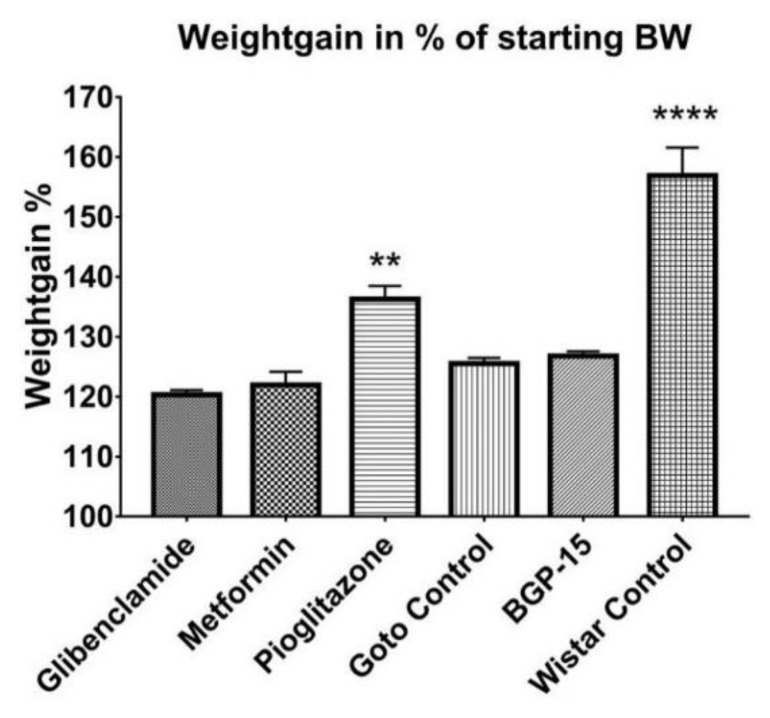
Figure 3.
Weight gain percentages of the animal groups: mean weight of animals of each group at the end of the experiment expressed in percentages of their initial mean weight. Data is presented as group mean ± standard error of the mean (SEM); n = 6 animals in each group. ** p < 0.01 compared to all other groups; **** p < 0.0001 compared to all other groups. Statistical analysis was done using GraphPad Prism: after estimation of Gaussian distribution with Shapiro-Wilk normality test data was either analysed with one-way analysis of variance (ANOVA) or non-parametric Kruskal-Wallis test.

