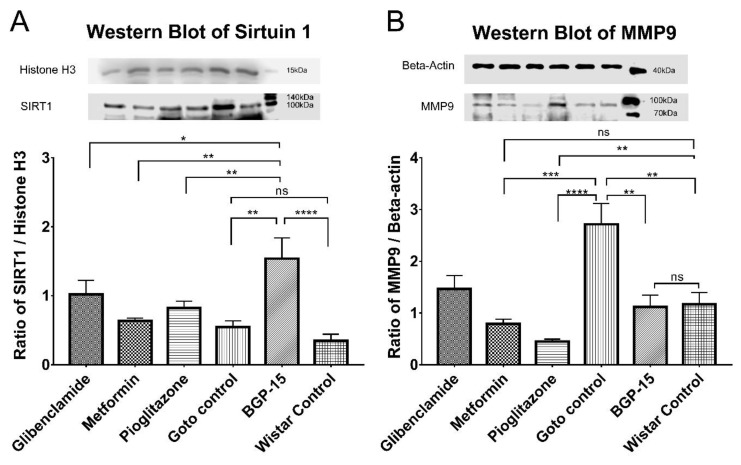
Figure 10.
Western Blot results. (A) Expression levels of Sirtuin 1 (SIRT1) in the different groups of the study. (B) Expression levels of Matrix metalloproteinase 9 (MMP9) in the different groups. Detected proteins: Histone H3 (~17kDa), SIRT1 (~120kDa), beta-actin (~42kDa), MMP9 (~92kDa). All data are presented as group mean ± standard error of the mean (SEM); n = 6 animals in each group. * p < 0.05; ** p < 0.01; *** p < 0.001; **** p < 0.0001; ns = non-significant. Statistical analysis was done using GraphPad Prism: after estimation of Gaussian distribution with Shapiro-Wilk normality test data was either analysed with one-way analysis of variance (ANOVA) or non-parametric Kruskal-Wallis test.

