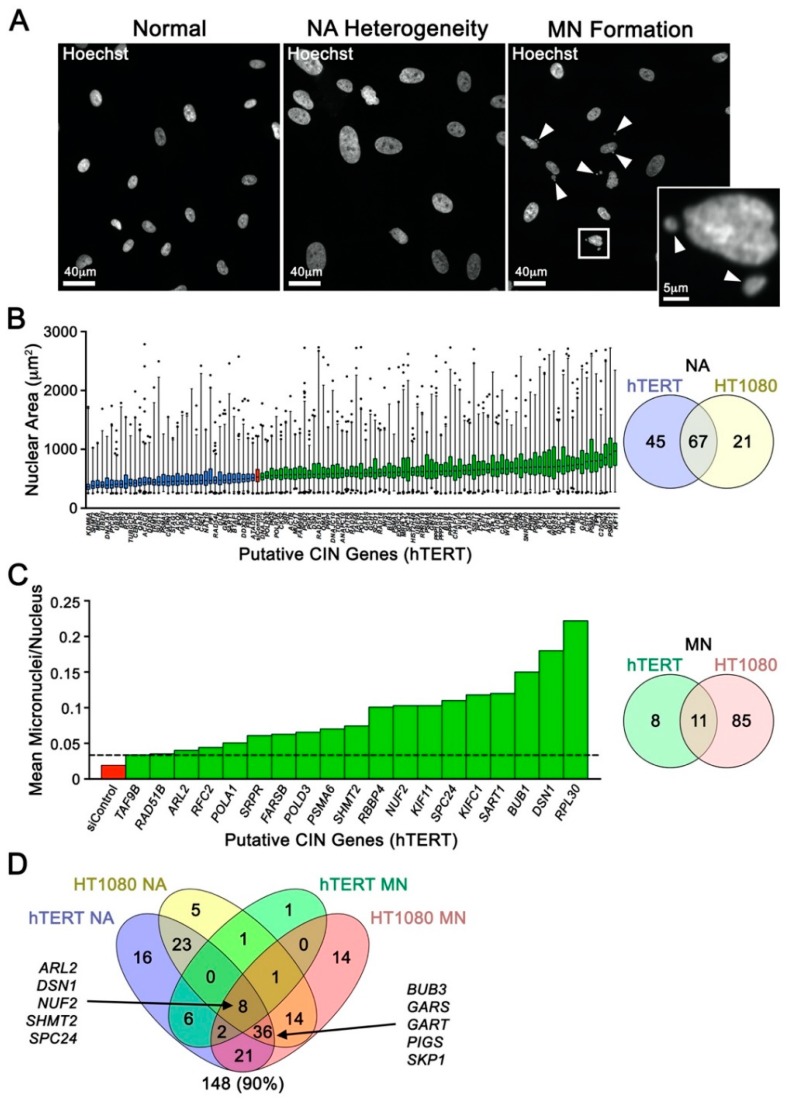
Figure 1.
Single-Cell Quantitative Imaging Microscopy Uncovers Putative Chromosome Instability (CIN) Genes. (A) Representative fluorescent microscopy images highlighting nuclear area (NA) size heterogeneity (center) and micronucleus formation (right; arrowheads) that accompany silencing of a CIN gene relative to karyotypically stable cells (left). (B) Box-and-whisker graph (left) displaying 1st–99th percentiles (whiskers) and the interquartile range (25th, 50th, and 75th percentiles) of NA data for putative CIN gene identified from the single-cell quantitative imaging microscopy (scQuantIM) screen performed in hTERT. Note that only genes inducing statistically significant decreases or increases in cumulative NA distributions relative to control (siControl; red) are presented and are indicated in blue and green, respectively. Venn diagram (right) displaying the numbers of putative CIN genes identified in the scQuantIM NA screen in both hTERT and HT1080. (C) Bar graph (left) presenting the normalized number of micronuclei/nucleus following silencing of candidate CIN genes (green) in hTERT. Only those genes inducing micronucleus (MN) formation above the minimum threshold (mean + 2 SD of siControl; dashed line) are presented. Venn diagram (right) displaying the numbers of putative CIN genes identified in the scQuantIM MN formation screen in both hTERT and HT1080. (D) Venn diagram reveals 148 putative CIN genes were identified from the NA and MN formation screens performed in hTERT and HT1080. The 10 genes selected for subsequent validation are indicated.

