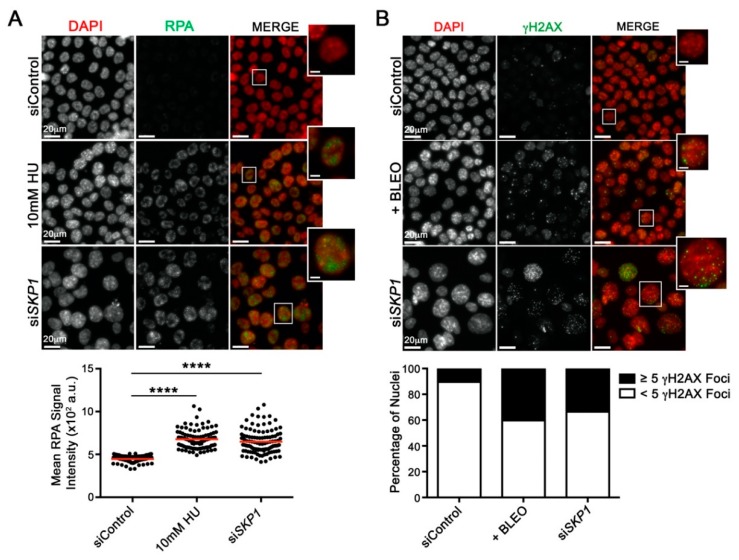
Figure 4.
SKP1 Silencing Induces Replication Stress and DNA Damage. (A) Representative maximum intensity projections (top; micrographs) showing visual increases in Replication Protein A (RPA) labeling in HCT116 cells following SKP1 silencing relative to siControl; hydroxyurea (HU) is a positive control. Note that all images were acquired using identical exposure times. For illustrative purposes, a single nucleus is magnified from each condition (bounding box; scale bar represents 5 µm). ScQuantIM (bottom; dot plot) reveals significant increases in mean RPA signal intensity following SKP1 silencing (or HU treatment) relative to siControl (Student’s t-tests; **** = p-value < 0.0001). (B) Qualitative images (top; micrographs) showing visual increases in γH2AX labeling in HCT116 cells following SKP1 silencing relative to siControl; bleomycin (BLEO) is a positive control. Note that all images were acquired using identical exposure times. A single nucleus is magnified from each condition (bounding box; scale bar represents 5 µm). ScQuantIM (bottom; bar graph) reveals a 3.2-fold increases in the percentage of nuclei harboring ≥5 γH2AX foci (black) following SKP1 (33.5%) silencing relative to siControl (10.4%); bleomycin treatments increased 3.9-fold (40.3%).

