Figure 5.
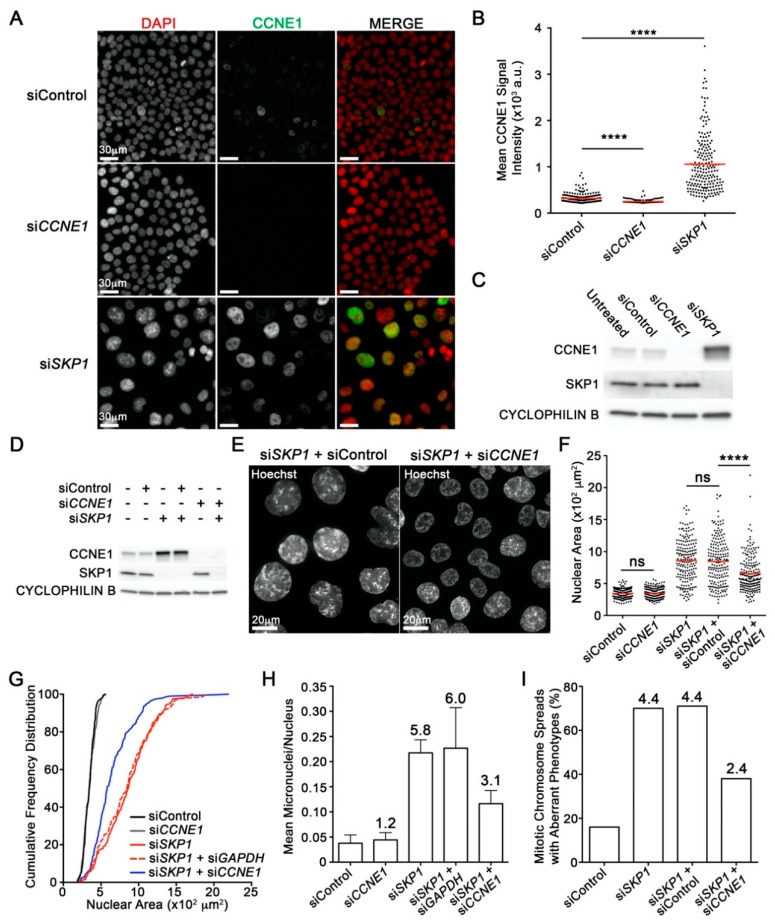
SKP1 Silencing Induces Increases in Cyclin E1 (CCNE1) Levels that Contribute to CIN. (A) Qualitative micrographs showing visual increases in CCNE1 (green) levels following SKP1 silencing in HCT116 cells. Images were acquired using identical exposure times. (B) Dot plot showing statistically significant increases in mean CCNE1 signal intensity (red line) in siSKP1 cells relative to siControl (Student’s t-test, **** = p-value < 0.0001). (C) Western blot confirms CCNE1 protein levels increase following SKP1 silencing. See Figure S4A for detailed information. (D) Western blot showing effective individual and co-silencing of SKP1 and CCNE1 in HCT116 cells. See Figure S4B for detailed information. (E) Qualitative images showing visual decreases in NAs (phenotypic rescue) in co-silenced (siSKP1 + siCCNE1) cells relative to control (siSKP1 + siControl) cells. (F) ScQuantIM reveals significant decreases in mean NAs (red line) following co-silencing (siSKP1 + siCCNE1) relative to control (siSKP1 + siControl) (Student’s t-test, p-value <0.0001). (G) Co-silencing (siSKP1 + siCCNE1) induces a significant phenotypic rescue (leftward shift) towards a smaller NA distribution relative to siSKP1 or siSKP1 + siControl (KS test, p-value <0.0001). (H) Bar graph showing a decrease in mean MN formation (+ SD) following co-silencing (siSKP1 + siCCNE1) relative to controls (siSKP1 or siSKP1 + siControl); fold increase relative to siControl is presented above each bar. (I) Bar graph showing a decrease in the percentage of aberrant mitotic chromosome spreads following co-silencing relative to siSKP1 or siSKP1 + siControl; fold increase is indicated.

