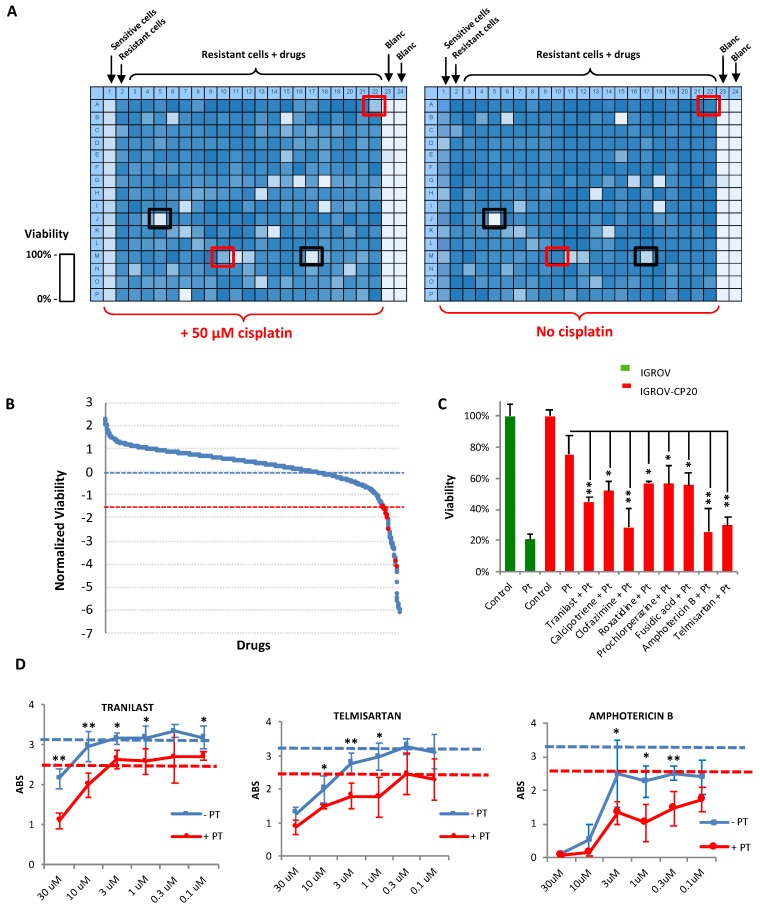
Figure 2.
Synthetic lethality screening revealed FDA-approved drugs that promote platinum (Pt)-mediated death of IGROV-CP20 cells. (A) Heat maps showing the MTT signal (with blue indicating cell survival and white cell death) in two 384-well plates from the high-throughput screen (HTS). Sensitive IGROV cells were used as controls for cisplatin efficiency, while IGROV-CP20 cells were seeded in the central areas of each plate and treated with drugs from a library of 1280 FDA-approved molecules. For each set of drugs from the library one plate was treated with 50 µM cisplatin while the second plate with identical array of drugs was left without cisplatin. Drugs killing the cells only in combination with cisplatin were considered as the hits (red boxes), while drugs inducing cell death per se (black boxes) were excluded. (B) The panel shows the outcome of the screening. The average viability of IGROV-CP20 cells in cisplatin was considered as 0 (blue dash line). Standard deviation (SD) values of IGROV-CP20 cells in cisplatin were used to normalize the average MTT signal for each drug. Each drug, whose combination with cisplatin caused decrease in viability beyond an arbitrary threshold of 1.5 SDs (red dash line) was considered as a hit (red circle) if this drug did not induce toxicity without cisplatin. (C) The graph shows the percentage viability of IGROV-CP20 cells after treatment with the positive hits in combination with cisplatin (Pt) (n = 3 experiments; * p < 0.05, ** p < 0.01, ANOVA). (D) Quantification of MTT absorbance (as readout of viability) shows dose-response curves of Tranilast, Telmisartan, and Amphotericin B added to IGROV-CP20 cells with (red line) or without (blue line) 50 µM cisplatin. The blue dashed line shows viability in untreated cells, while the red dashed line shows viability in the cells treated with cisplatin alone. Data represent the average of six different experiments (* p < 0.05, ** p < 0.01, ANOVA).

