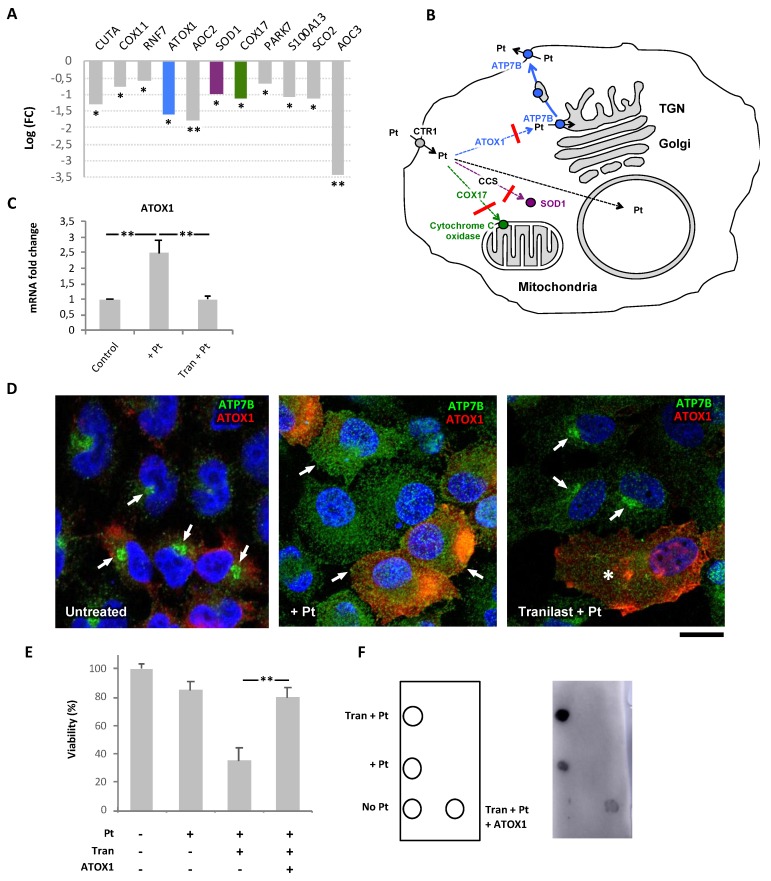
Figure 6.
Impact of Tranilast on Pt-transporting pathways in cisplatin-resistant IGROV-CP20 cells. (A) QuantSeq analysis shows the impact of Tranilast on the expression of the copper ion binding genes in cisplatin-treated IGROV-CP20 cells (n = 3 experiments; * p < 0.05, ** p < 0.01, ANOVA). The genes playing a key role in the distribution of Pt across the cell (ATOX1, SOD1, and COX17) are shown in different colors corresponding to the specific intracellular route shown in panel B. (B) The scheme depicts Pt intracellular routes. Downregulation of ATOX1, SOD1, and COX17 by Tranilast (red crossbars) inhibits Pt delivery to the secretory pathway (blue arrows), mitochondria (green arrows), or SOD1-mediated detoxification pathway (magenta arrow). This favors delivery of Pt to the cell nucleus (dashed black arrow) leading to enhanced DNA damage. (C) qRT-PCR showed an increase in ATOX1 mRNA in cells treated with 50 µM cisplatin, while Tranilast inhibited Pt-mediated induction of ATOX1 expression (n = 3 experiments; ** p < 0.01, ANOVA). (D) IGROV-CP20 cells were transfected with pCDNA-ATOX1-FLAG and treated with 50 µM ciaplatin (Pt) or with a combination of 10 µM Tranilast and Pt (as indicated in the figure). The cells were then immuno-stained for ATP7B and FLAG. ATP7B was detected in the Golgi area in untreated cells (arrows, left panel) and at the cell surface and peripheral structures in Pt-treated cells (arrows, mid panel) regardless of ATOX1 overexpression. Tranilast blocked ATP7B in the Golgi area in Pt-treated cells, which did not overexpress ATOX1 (arrows, right panel), but failed to inhibit Pt-mediated redistribution of ATP7B from the Golgi in ATOX1-overexpressing cells (asterisks, right panel). (E) MTT viability assay was performed in cells treated with 50 µM cisplatin alone or in combination with 10 µM Tranilast (with and without ATOX1 overexpression). The plot shows that Tranilast did not reduce the viability of Pt-treated cells when ATOX1 is overexpressed (n = 3 experiments; ** p < 0.01, ANOVA). (F) Pt adducts were evaluated via dot immuno-blot of DNA samples spotted as indicated in the map on the left. Cisplatin (Pt) in association with Tranilast induced a significant increase in the DNA adduct signal compared to cells treated with cisplatin alone. ATOX1 overexpression inhibited the ability of Tranilast to promote DNA adduct formation in Pt-treated cells. Scale bar: 7 µm (D).

