Figure 6.
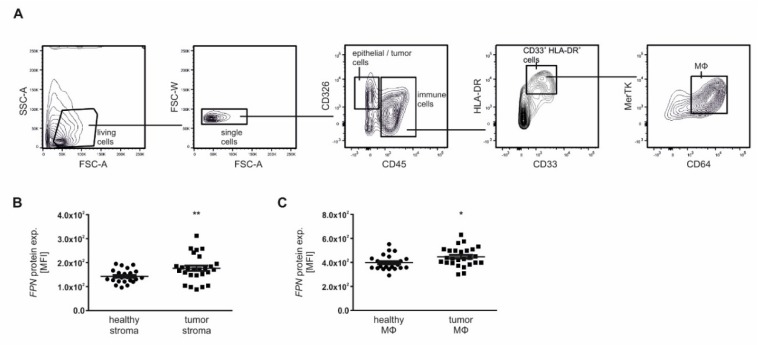
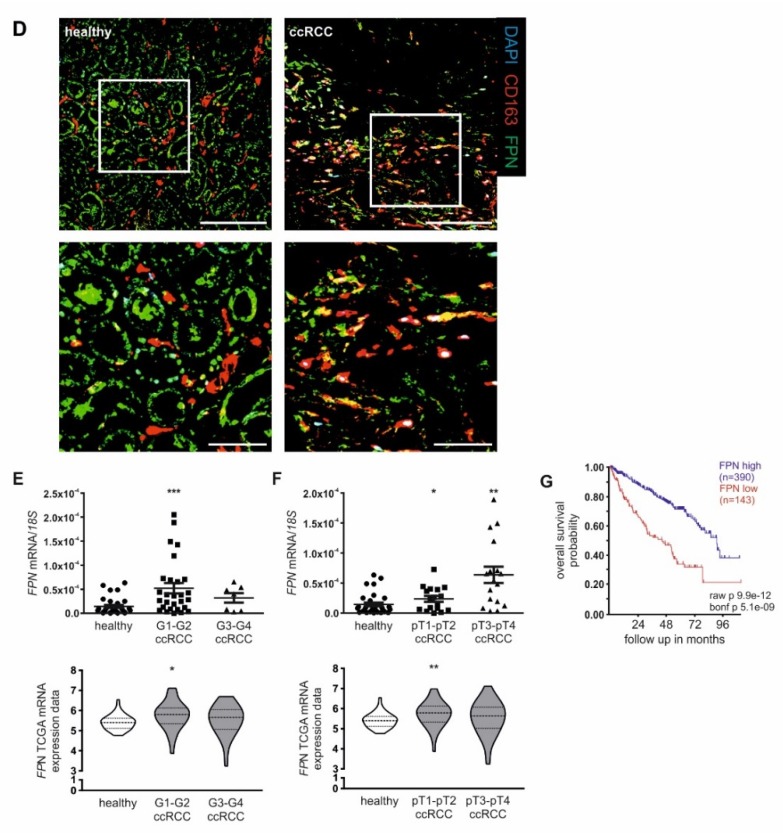
Tumor-associated MΦ express enhanced FPN protein. (A) FACS panel how to gate CD45+ immune cells and CD326+ epithelial/tumor cells. Immune cells were further gated for CD33+/HLA-DR+ cells of which CD64+ and MerTK+ MΦ were sub-selected. Cells were subsequently analyzed for their FPN protein expression, displayed as MFI (mean fluorescence intensity). (B) FPN protein expression as MFI of CD45-/CD326- stroma cells (n = 26). (C) FPN protein expression as MFI of MΦ in tumor tissue compared to adjacent healthy tissue (n = 26). (D) Representative pictures for the MΦ marker CD163 and FPN protein expression in tumor tissue compared to healthy adjacent tissue applying confocal laser scanning miscroscopy. DAPI was used as nuclear stain. Scale bar: 200 µm. FPN mRNA expression normalized to 18S expression correlated to (E) low (G1–G2) and high (G3–G4) tumor grade and (F) low (pT1–pT2) and high (pT3–pT4) tumor pT-stage in our patient cohort (upper panels; n = 48) compared to the TCGA data base, applying the ccRCC-KIRC data set (lower panels; n = 70). (G) Kaplan-Meier curve of high or low FPN expression from the R2 bioinformatics platform using the ccRCC-KIRC data set. Graphs are displayed as means ± SEM with * p < 0.05, ** p < 0.01, *** p < 0.001.


